Cursor Made Crystal Clear · chapter 1: What Cursor Actually Is
Adoption versus trust
2026-09-04
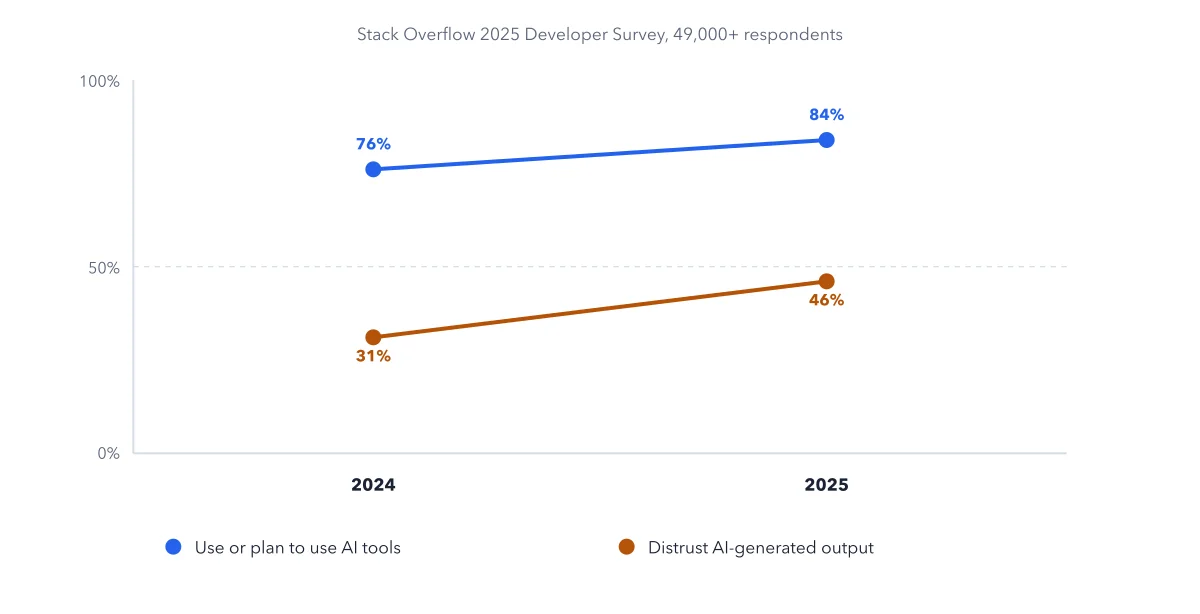
Usage keeps climbing and confidence in the output keeps falling, in the same survey, the same year.
Below: the paragraph from the book that builds this idea, then the diagram itself (Figure 1.2), and a recap. About a minute of reading.
Figure 1.2 draws both lines on one chart, because watching them move in opposite directions is more useful than reading either number alone. Usage keeps climbing. Confidence in what comes out keeps falling. Sixty-six percent of developers named a specific frustration behind that second number: dealing with AI output that is "almost right, but not quite," the single most common complaint in the survey. Remember that phrase. This book calls the same failure the 80-percent-done trap, and it returns in Chapters 8 and 12, with a controlled study behind it, not just a survey.
Recap
- The idea: Usage keeps climbing and confidence in the output keeps falling, in the same survey, the same year.
- The picture: Figure 1.2, from chapter 1 ("What Cursor Actually Is") of Cursor Made Crystal Clear.
- Go deeper: the chapter builds this step by step, with recipes and sources at the end.
This diagram is one of many in Cursor Made Crystal Clear.
Every chapter opens with the gist, draws the hard ideas, and ends with recipes and sources.
Get the book