
The diagrams
Every idea in the books is drawn before it is described. This is the drawings, one a day, each with the paragraphs that explain it. RSS feed.
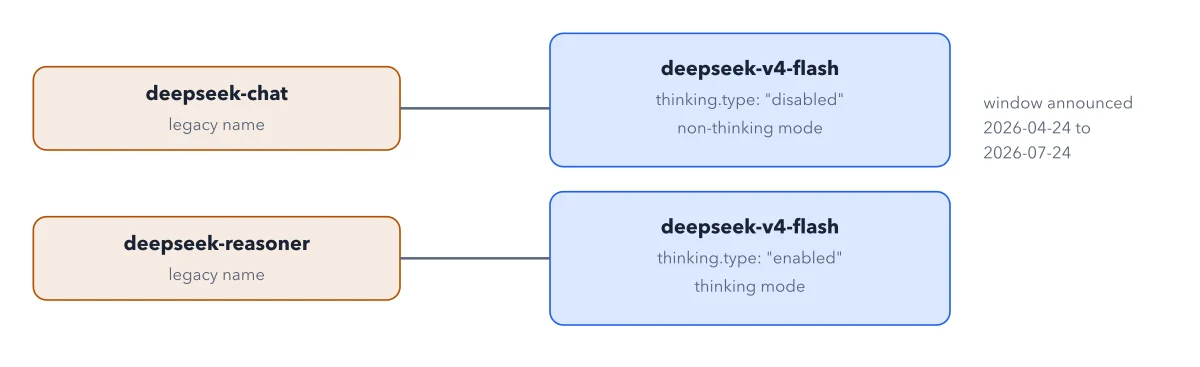
DeepSeek
Legacy names mapped to current ones
2026-10-12
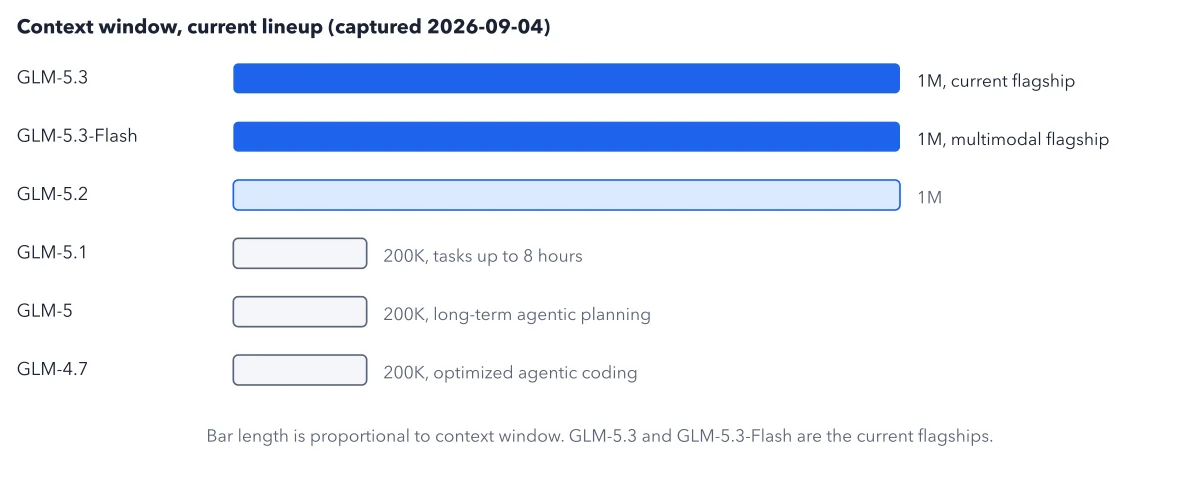
GLM
2026-10-12
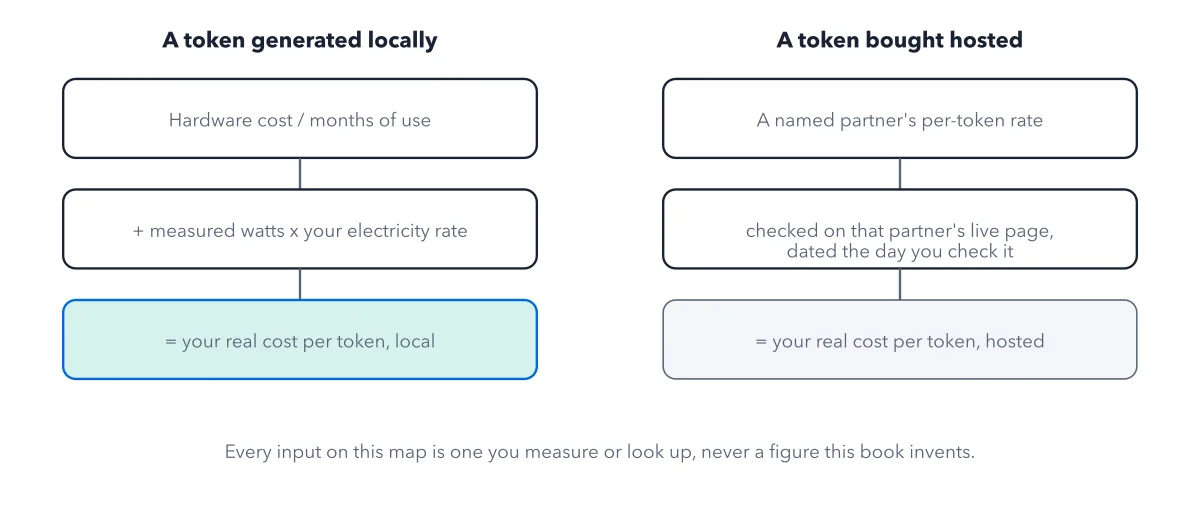
Llama
The meter map, tracing a locally generated token and a hosted token to their real cost...
2026-10-12
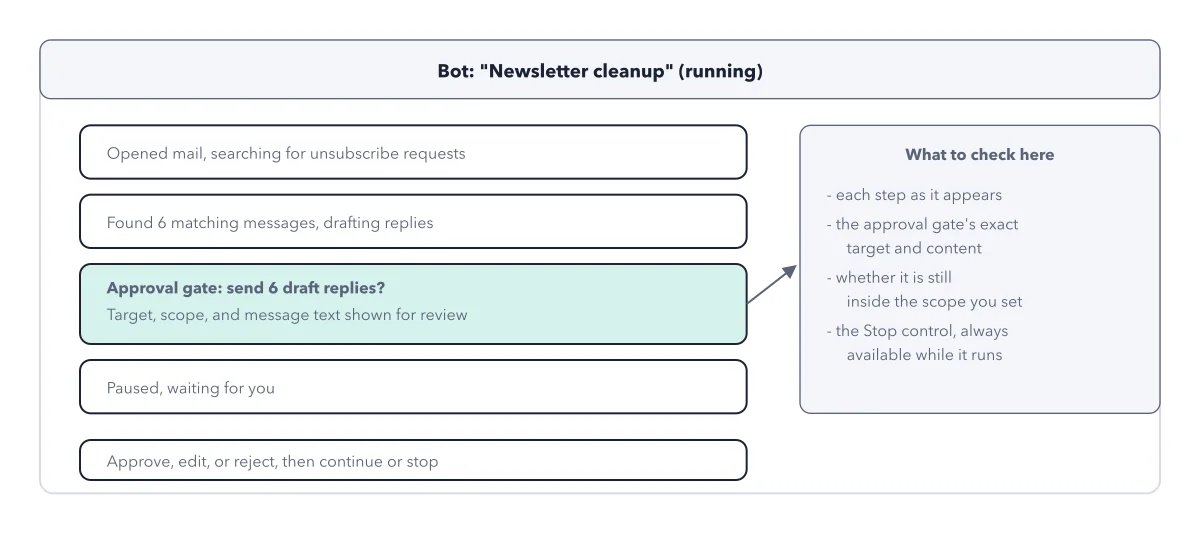
Grok Bot
The watching surface, annotated
2026-10-11
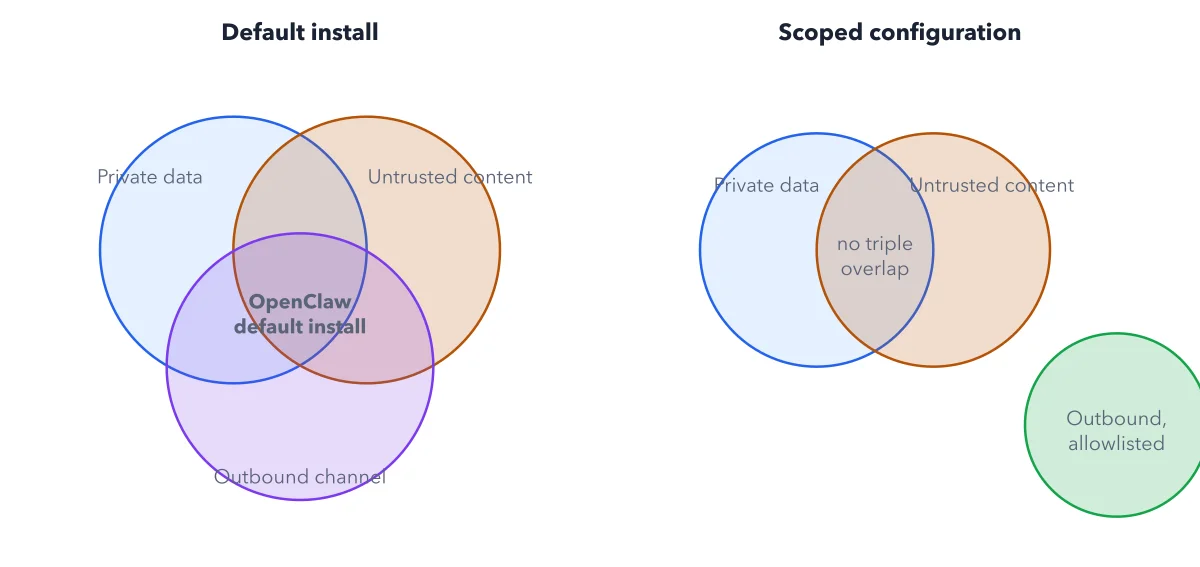
OpenClaw
The lethal trifecta
2026-10-11
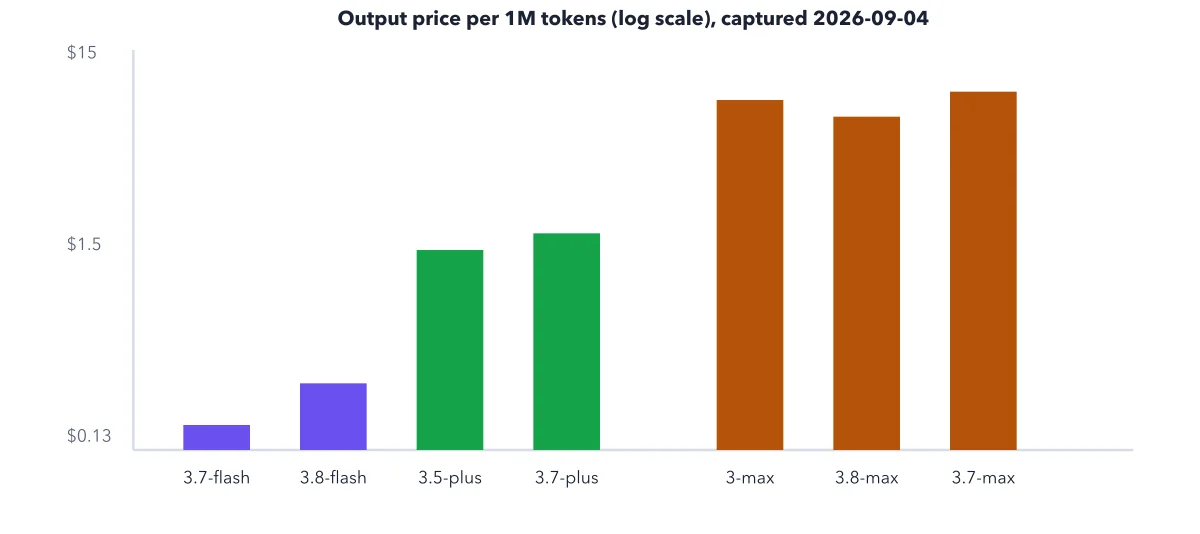
Qwen
The price ladder from Flash to Max, output rate per million tokens, log scale
2026-10-11
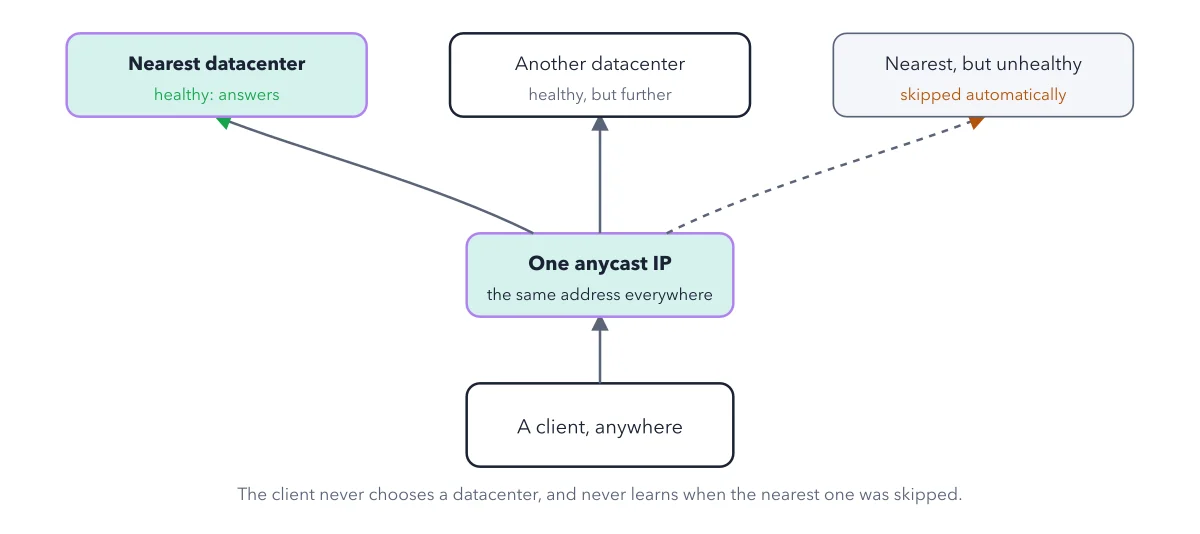
Fly.io
Anycast in one picture
2026-10-10
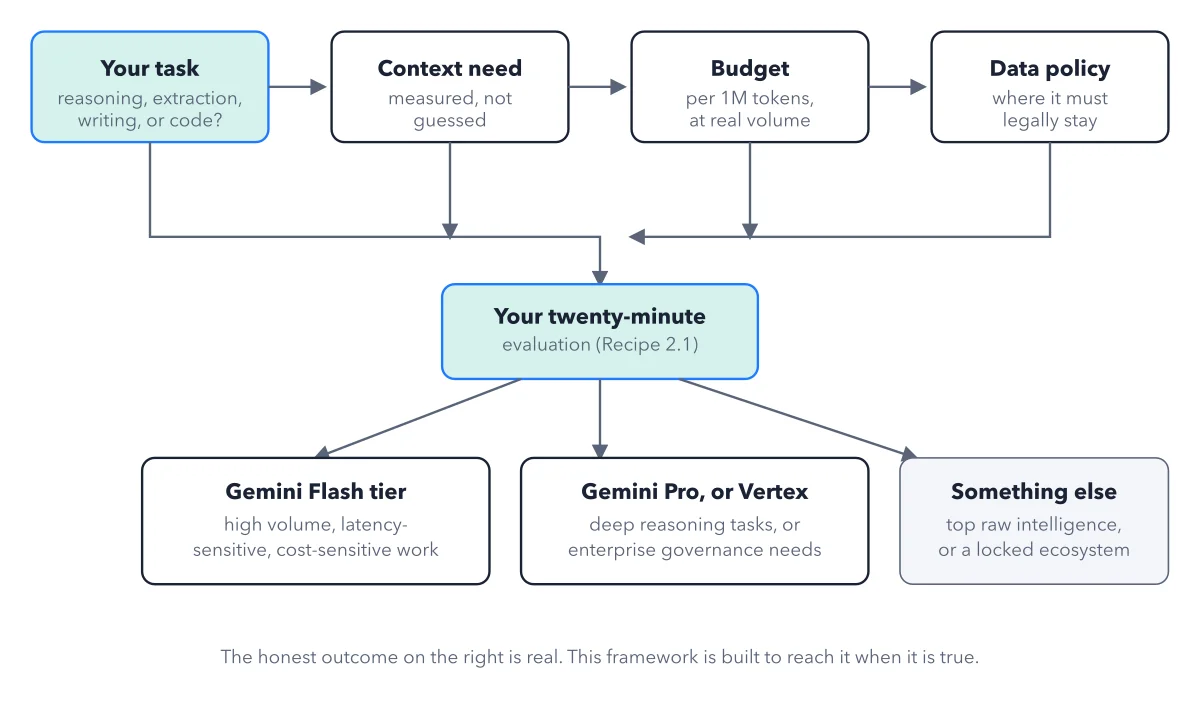
Gemini
The decision framework
2026-10-10
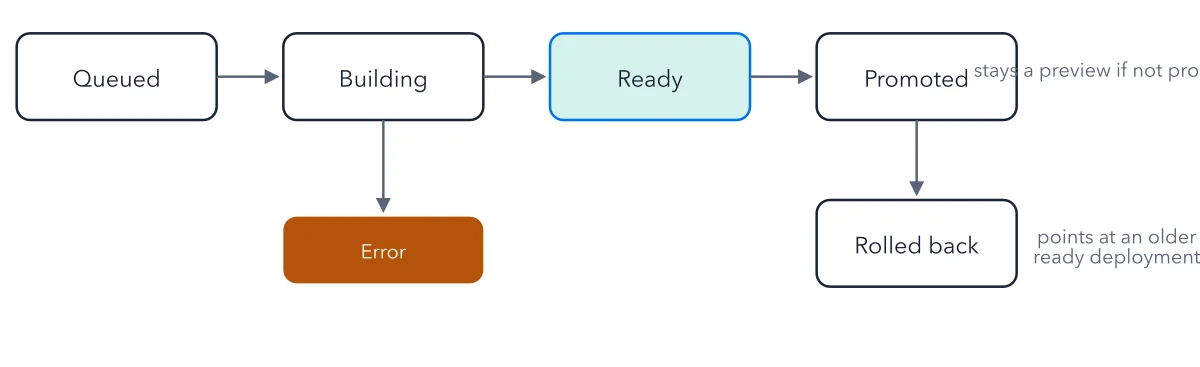
Vercel
Deployment lifecycle
2026-10-10
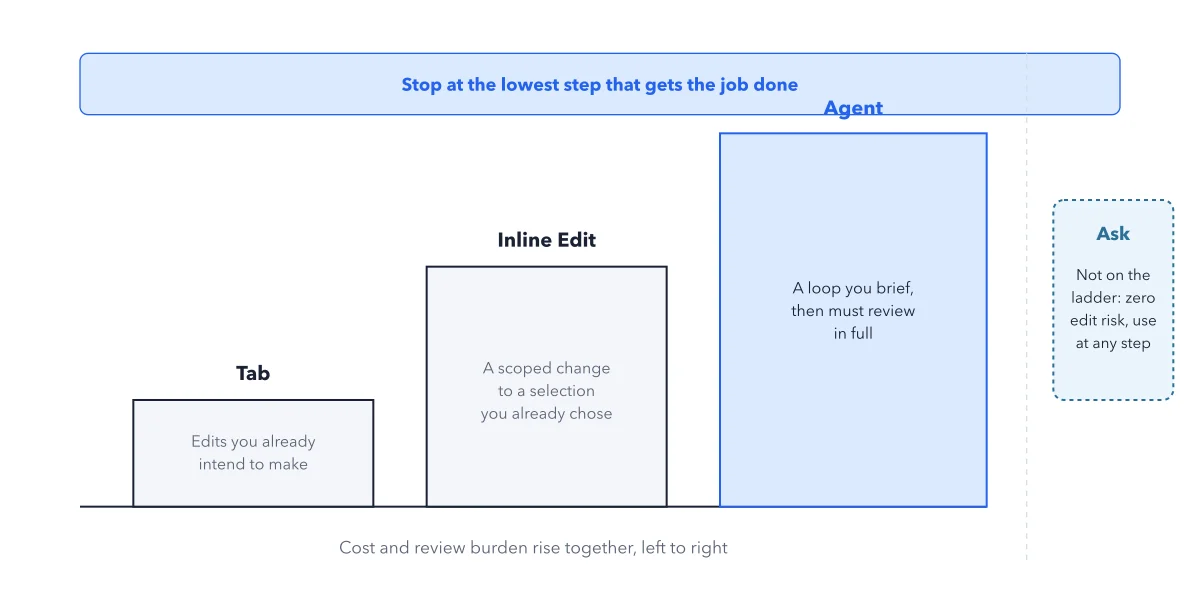
Cursor
The escalation ladder
2026-10-09
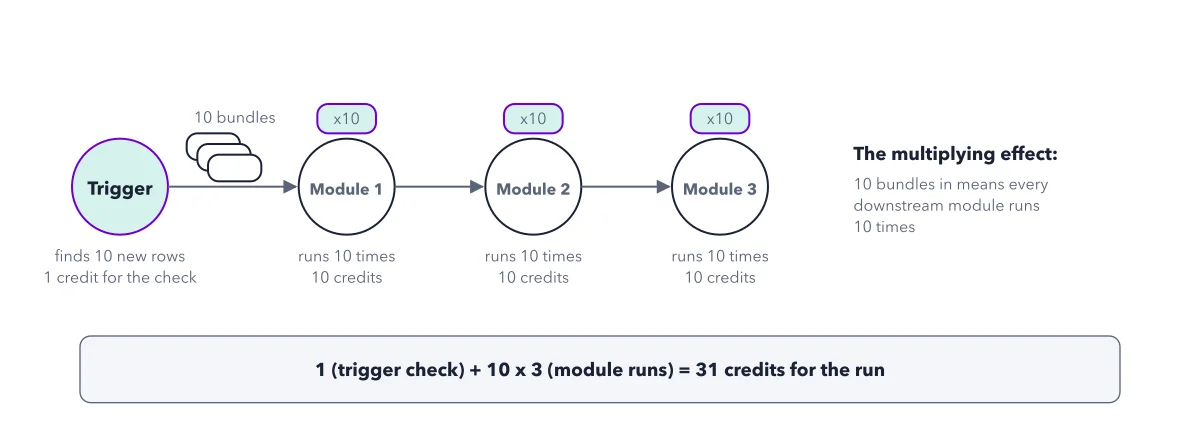
Make.com
The multiplying effect, using the worked example from Make's own documentation
2026-10-09
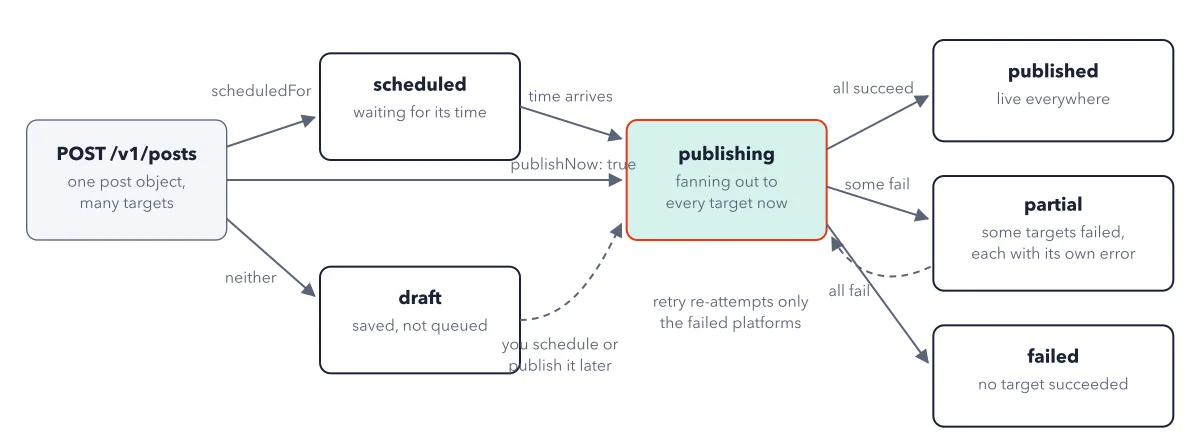
Zernio
The post lifecycle
2026-10-09
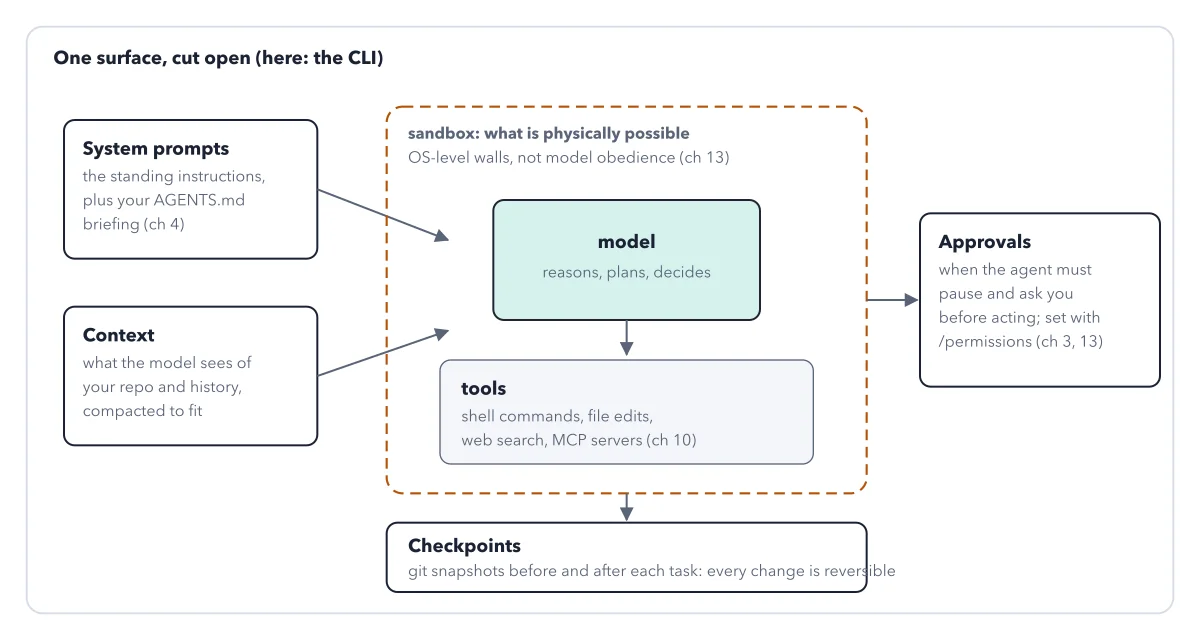
OpenAI Codex
Harness anatomy
2026-10-08
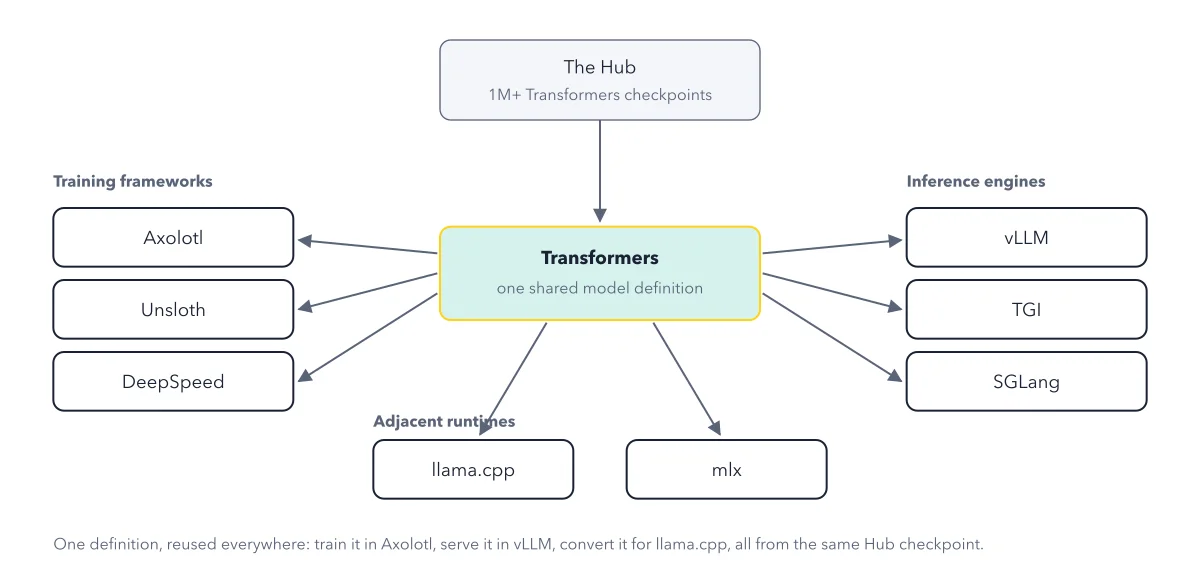
Hugging Face
Transformers as the ecosystem pivot
2026-10-08
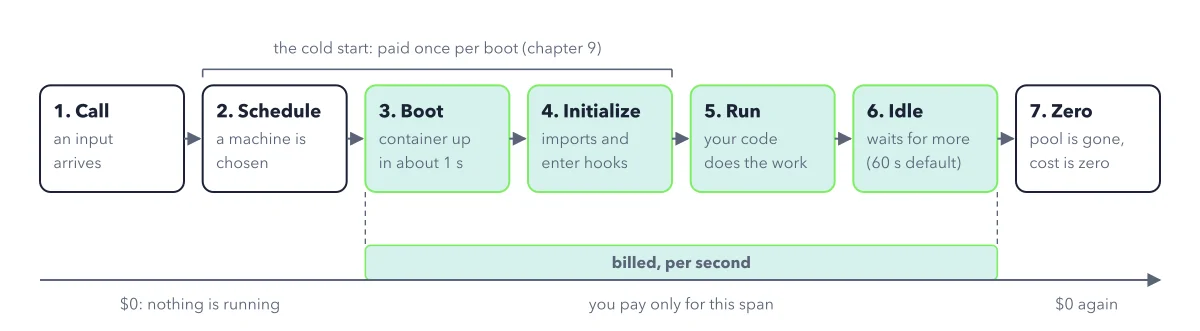
Modal
Life of a request
2026-10-08
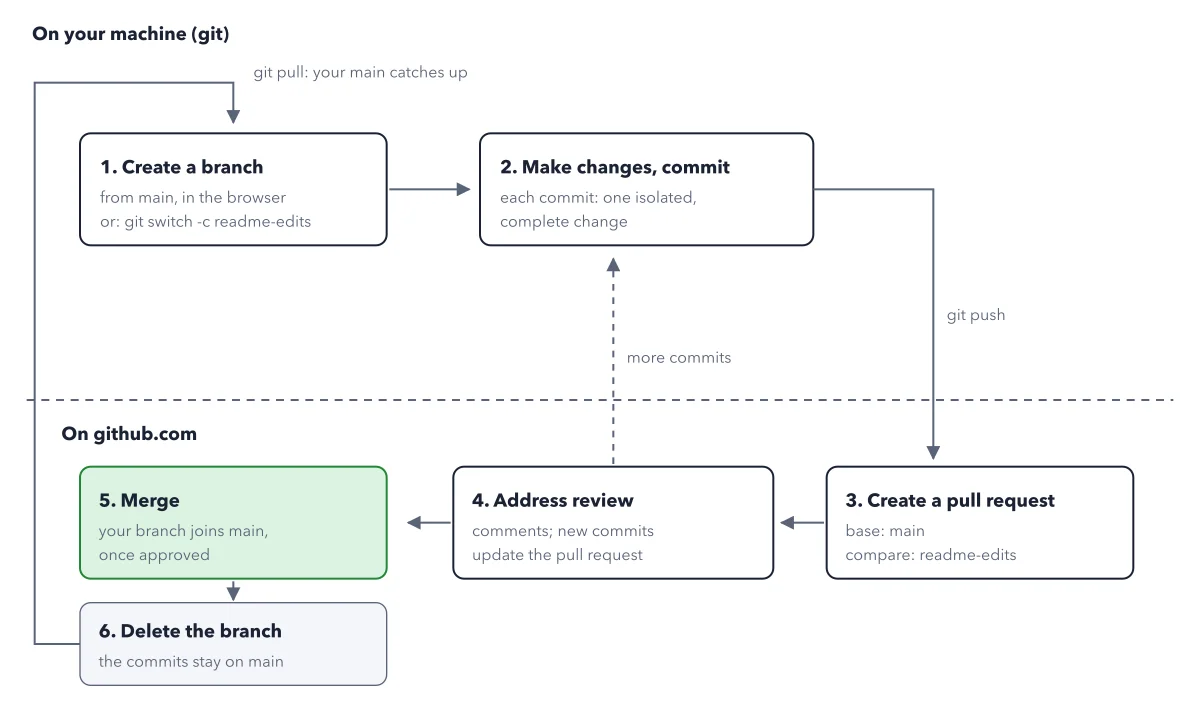
GitHub
The GitHub flow as a cycle
2026-10-07
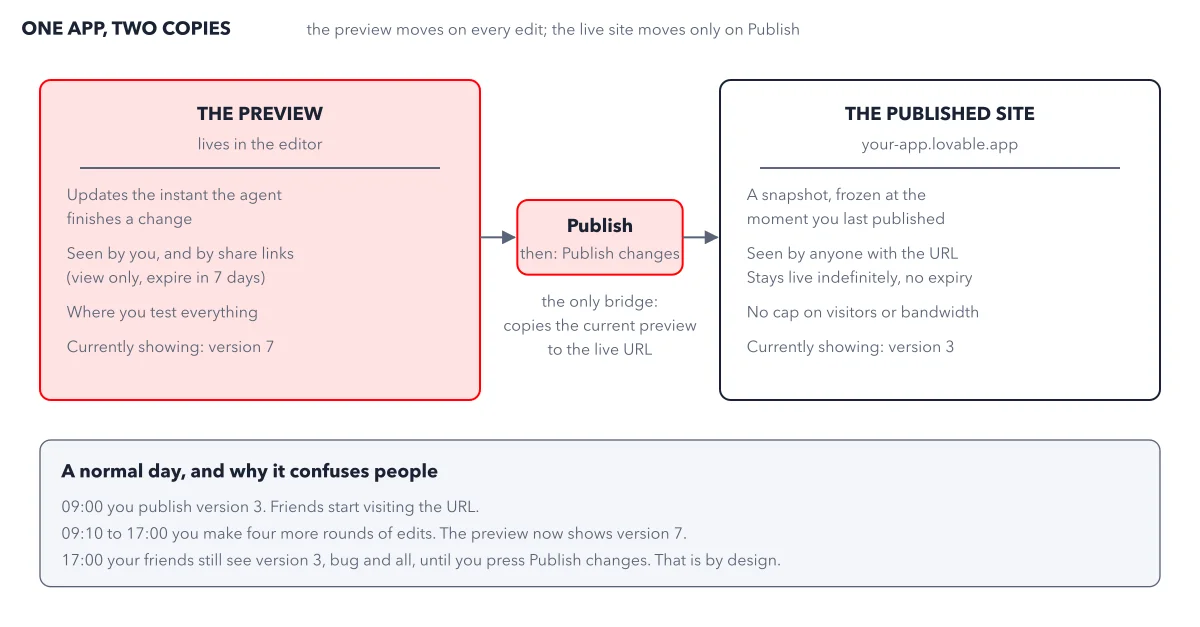
Lovable
Preview vs published
2026-10-07
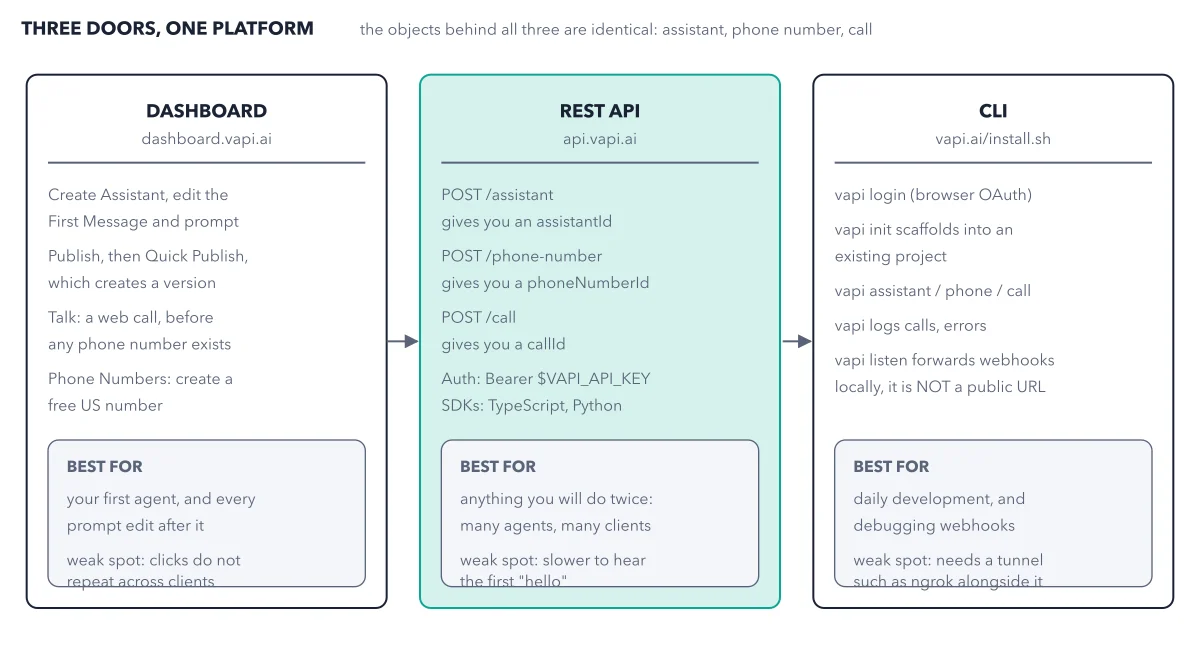
Vapi
the same three objects, three ways in
2026-10-07
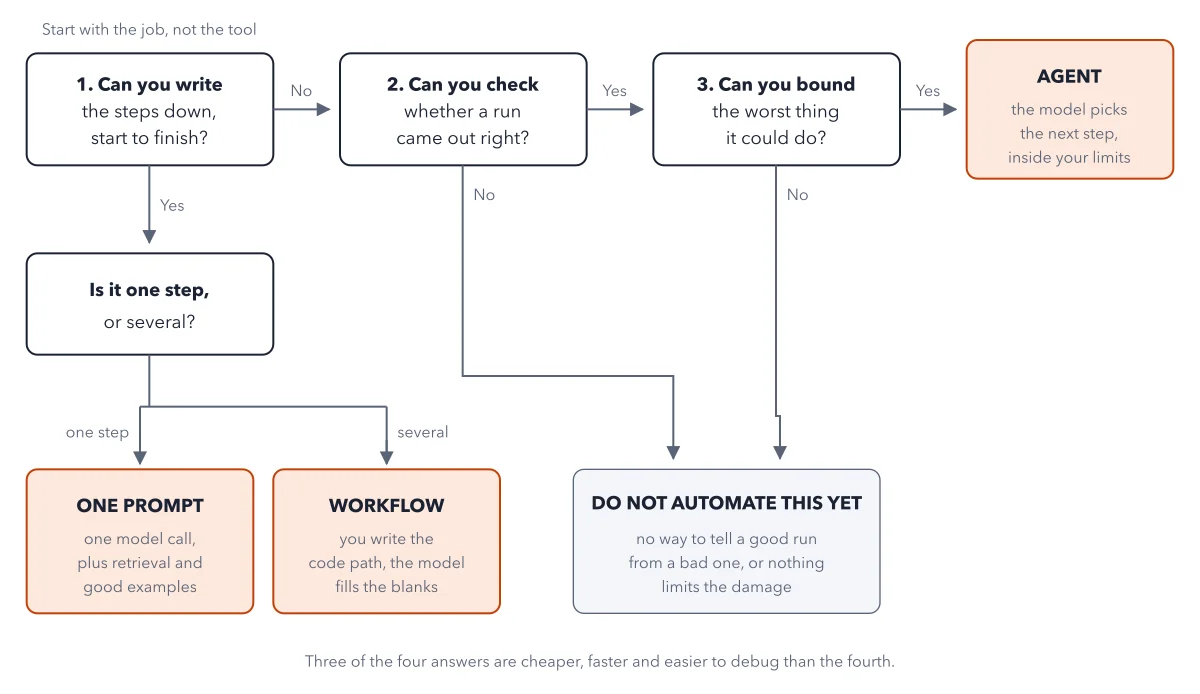
AI Agents
The decision tree
2026-10-06
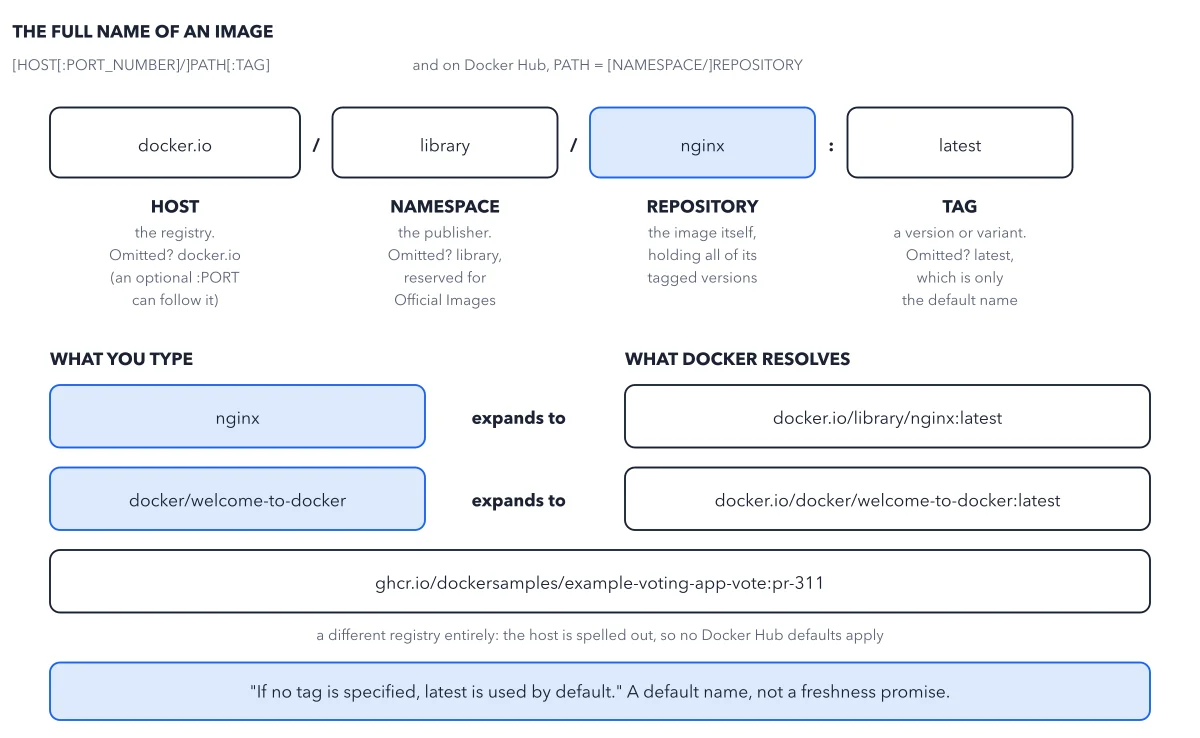
Docker
Tag anatomy
2026-10-06
n8n
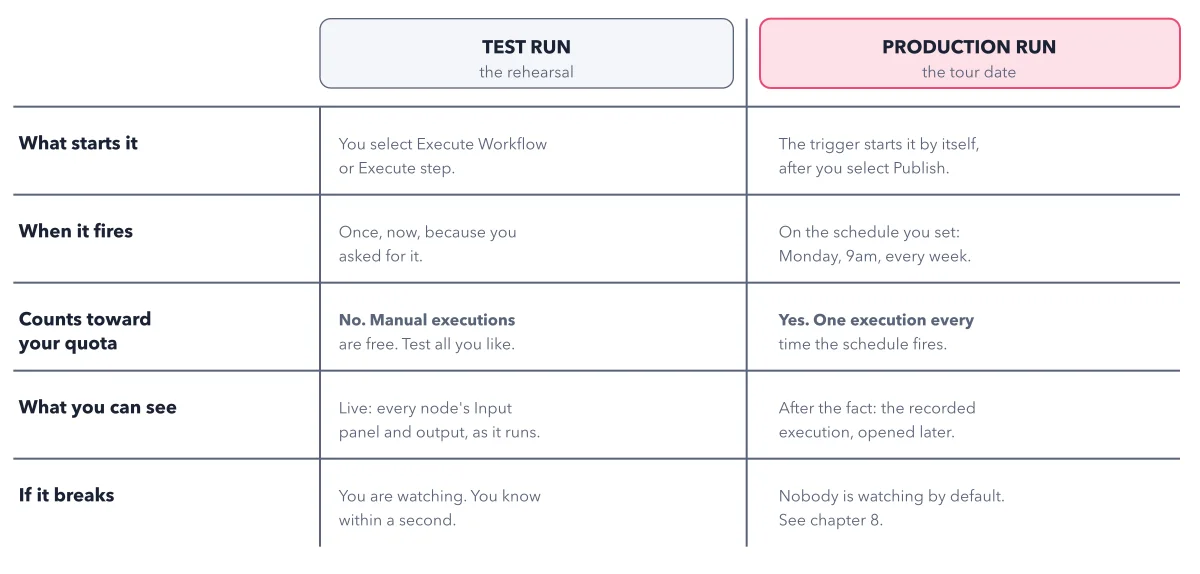
Test run versus production run: what fires, what counts toward the quota, and what you...
2026-10-06
ElevenLabs
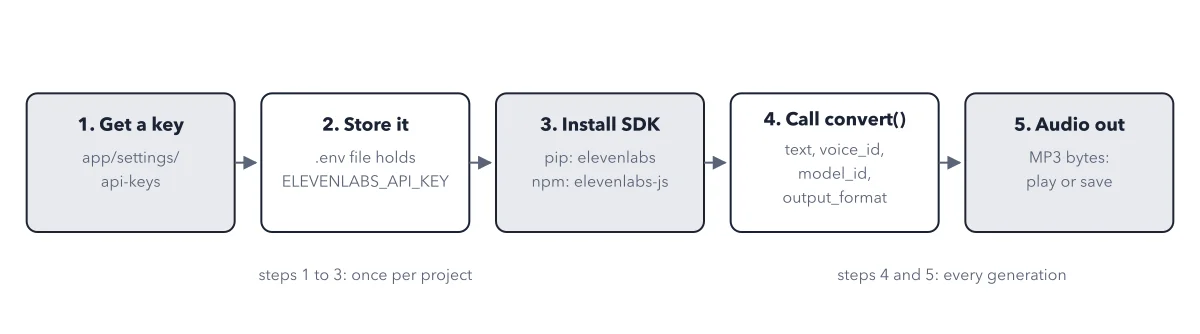
The quickstart path
2026-10-05
The +1 Method
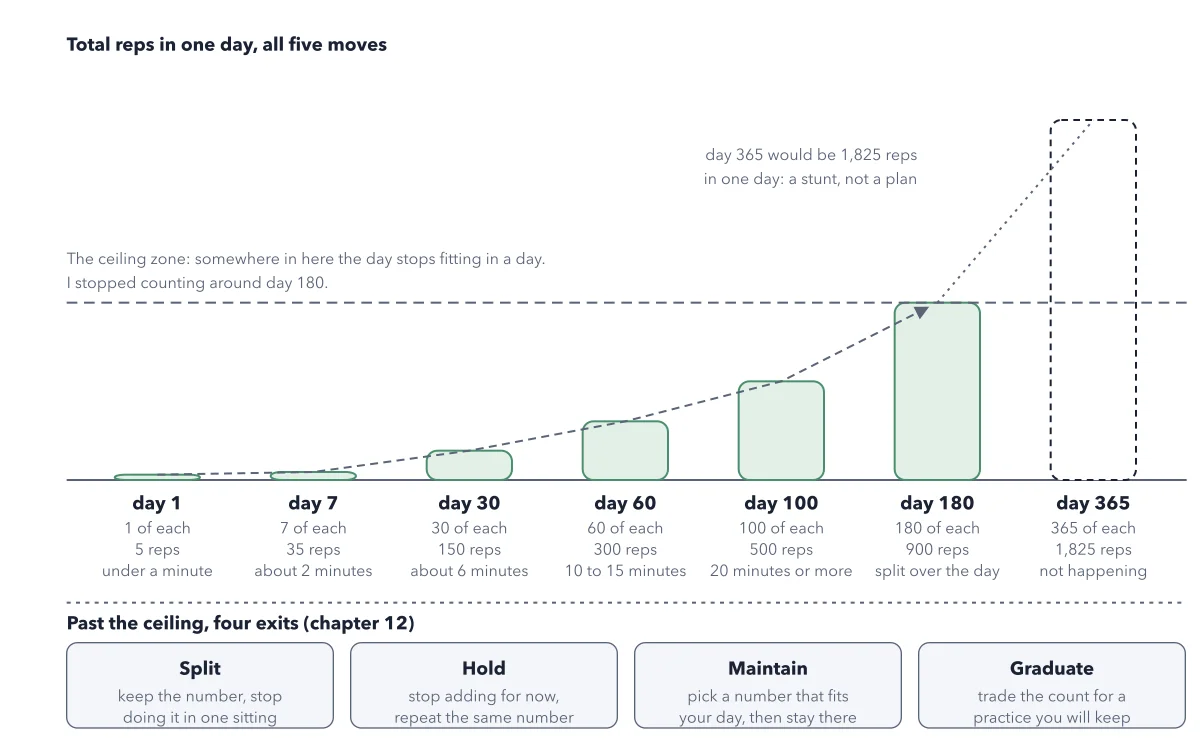
The ramp made visual
2026-10-05
Tech Hiring
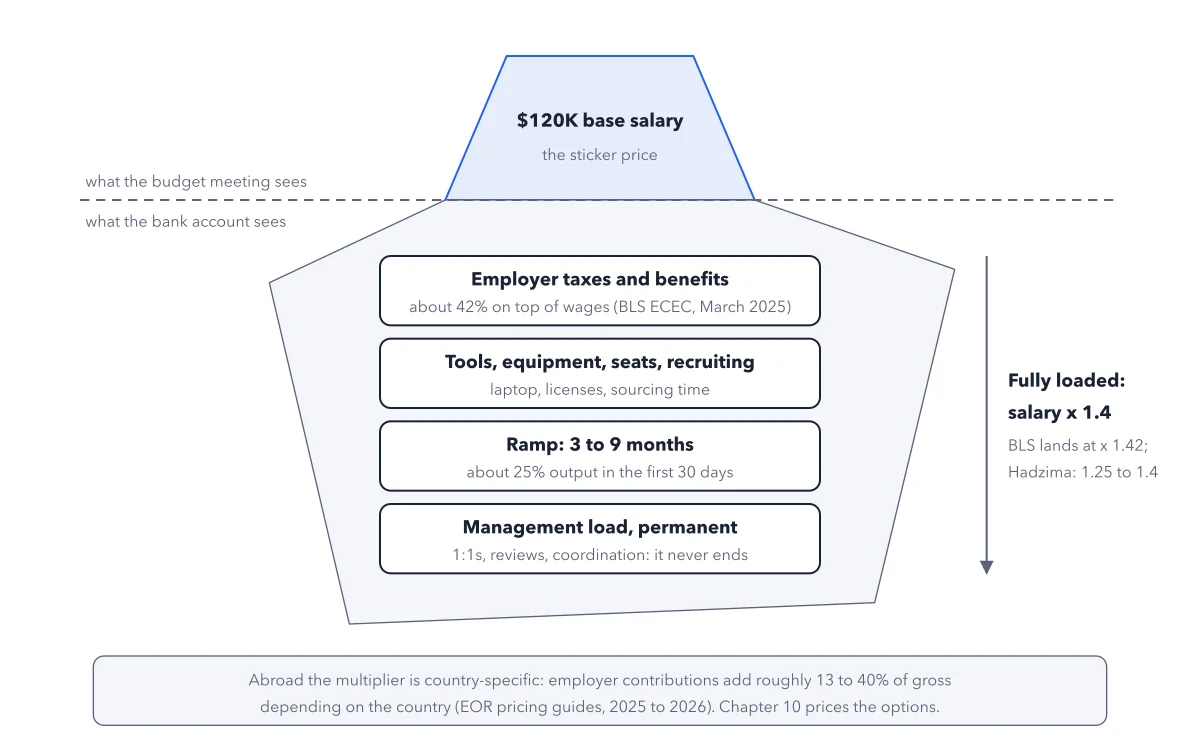
The true-cost iceberg
2026-10-05
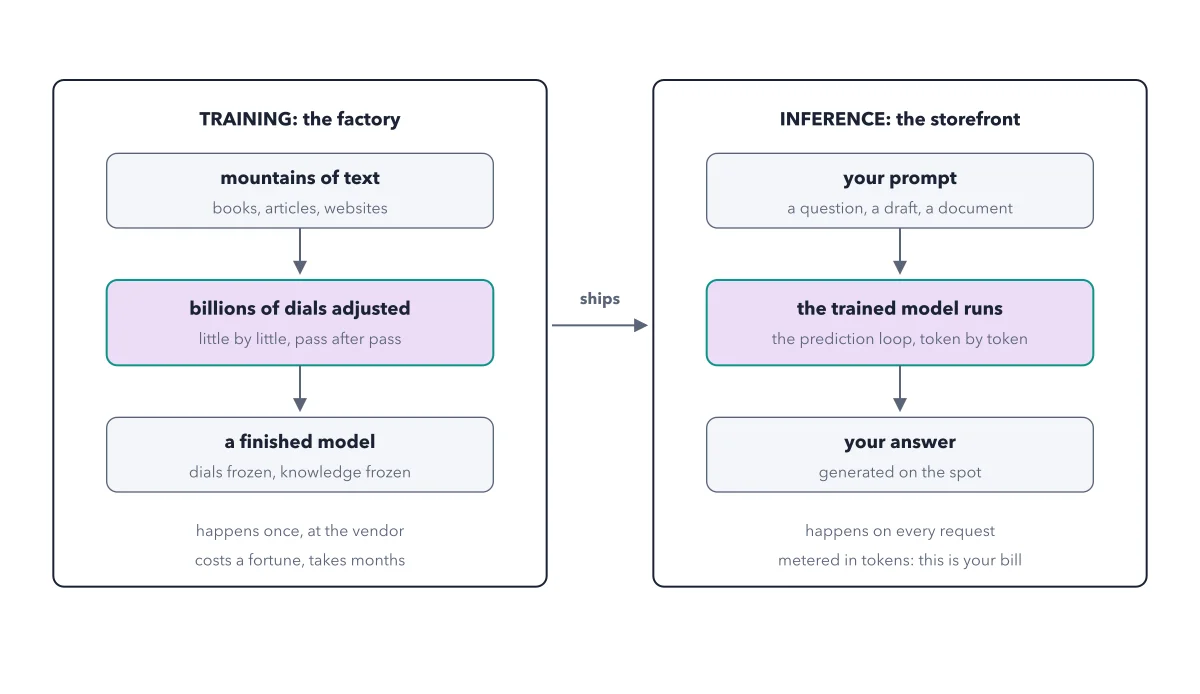
AI
Training and inference
2026-10-04
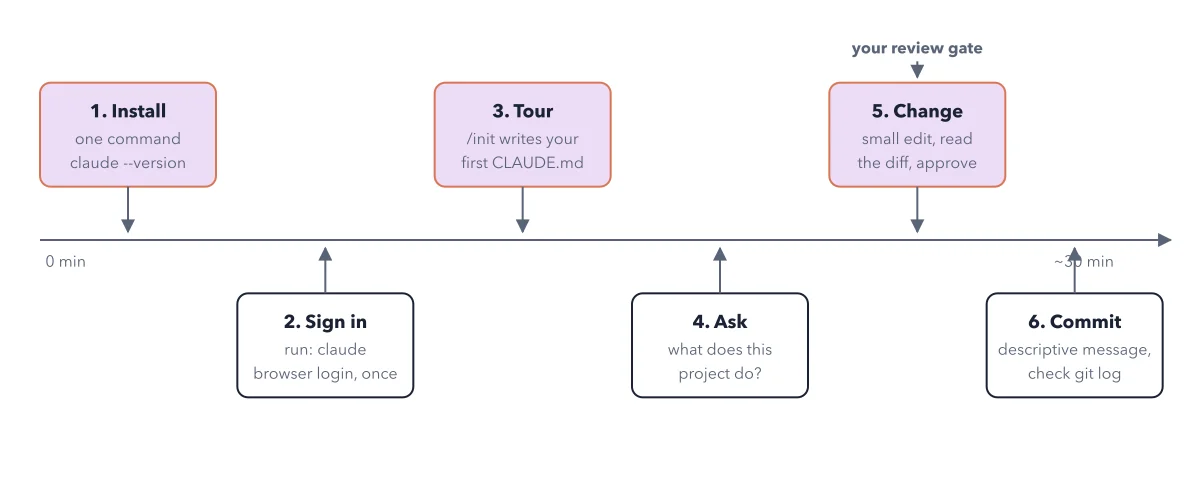
Claude Code
The zero to first change timeline
2026-10-04
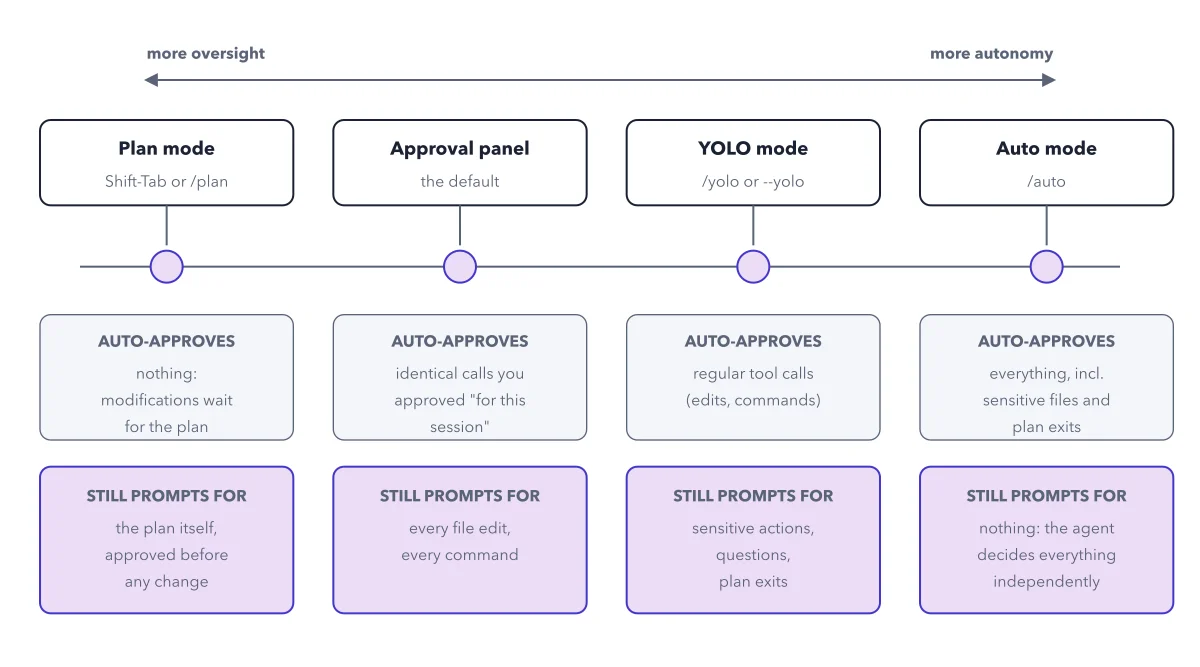
Kimi Code
The autonomy dial
2026-10-04
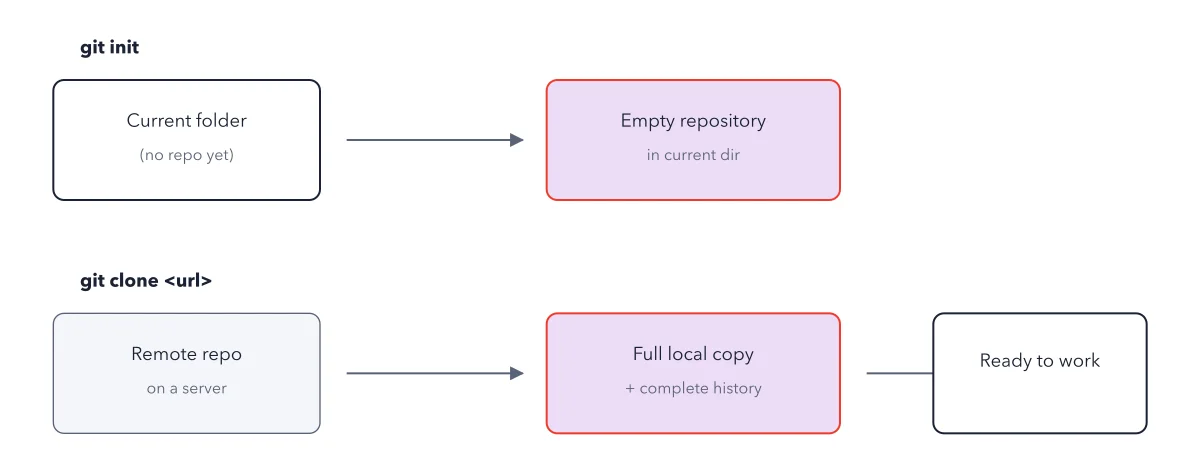
Git
init starts an empty repo in the current folder; clone copies a remote repo with its...
2026-10-03
Hermes Agent
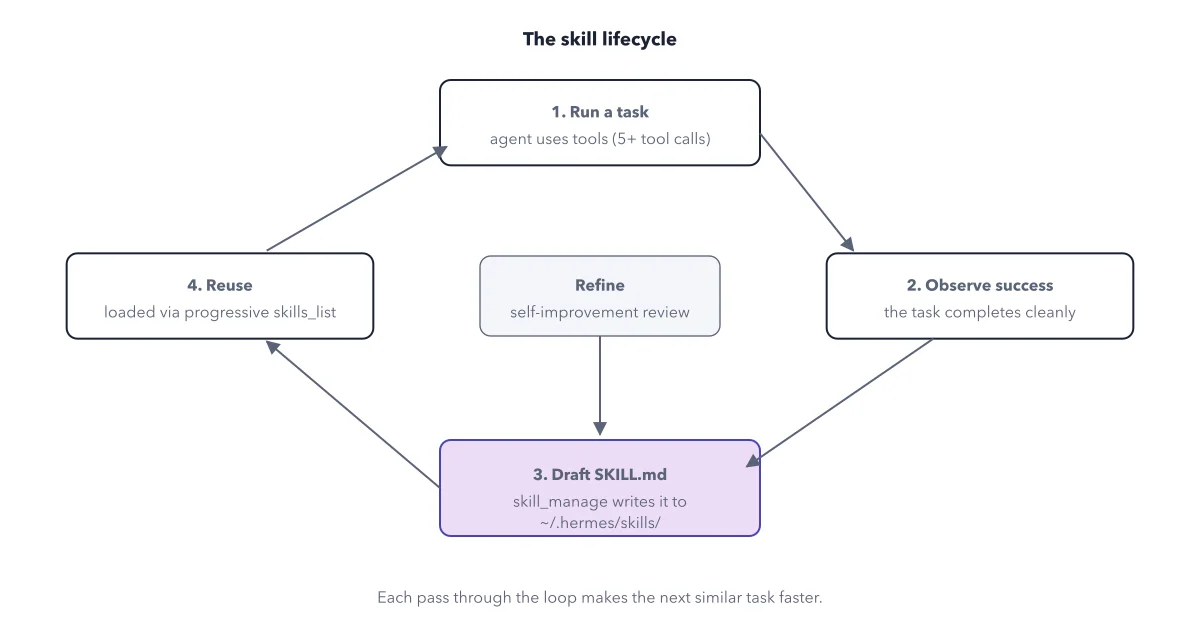
The skill lifecycle: observe repeated success, draft a SKILL.md, reuse it, and let the...
2026-10-03
Jev
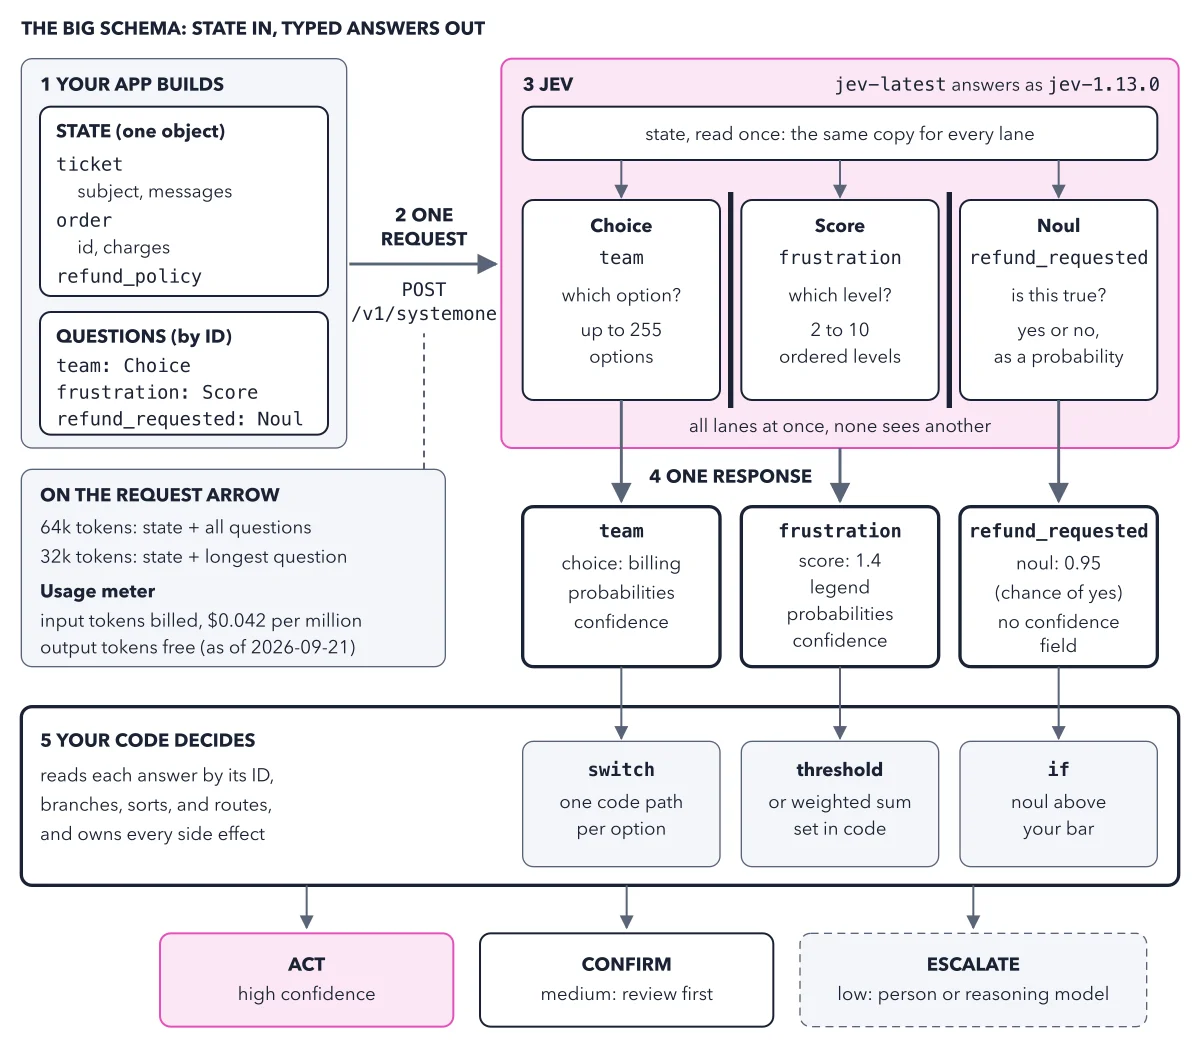
The big schema
2026-10-03
AI Video
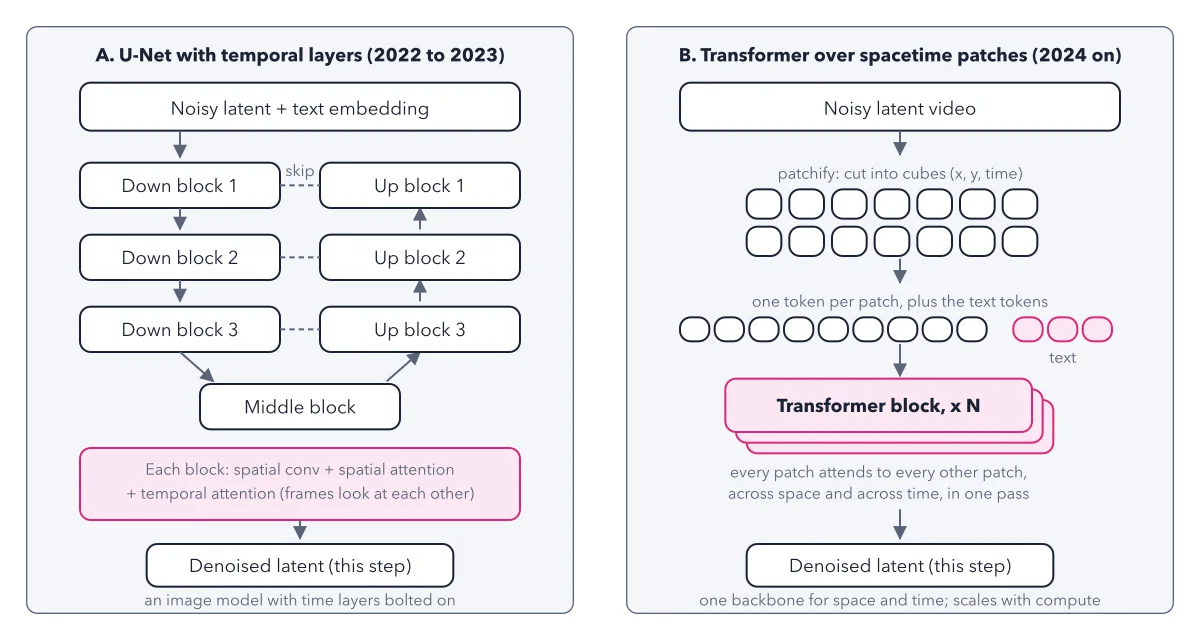
Two ways to build the denoiser
2026-10-02
OpenRouter
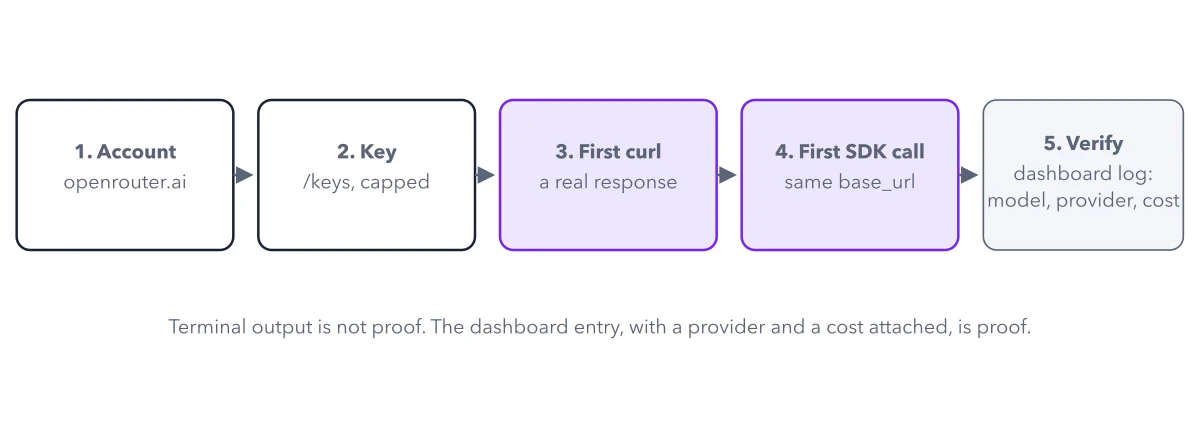
Quickstart sequence, from account to a verified first response in the dashboard
2026-10-02
Supabase
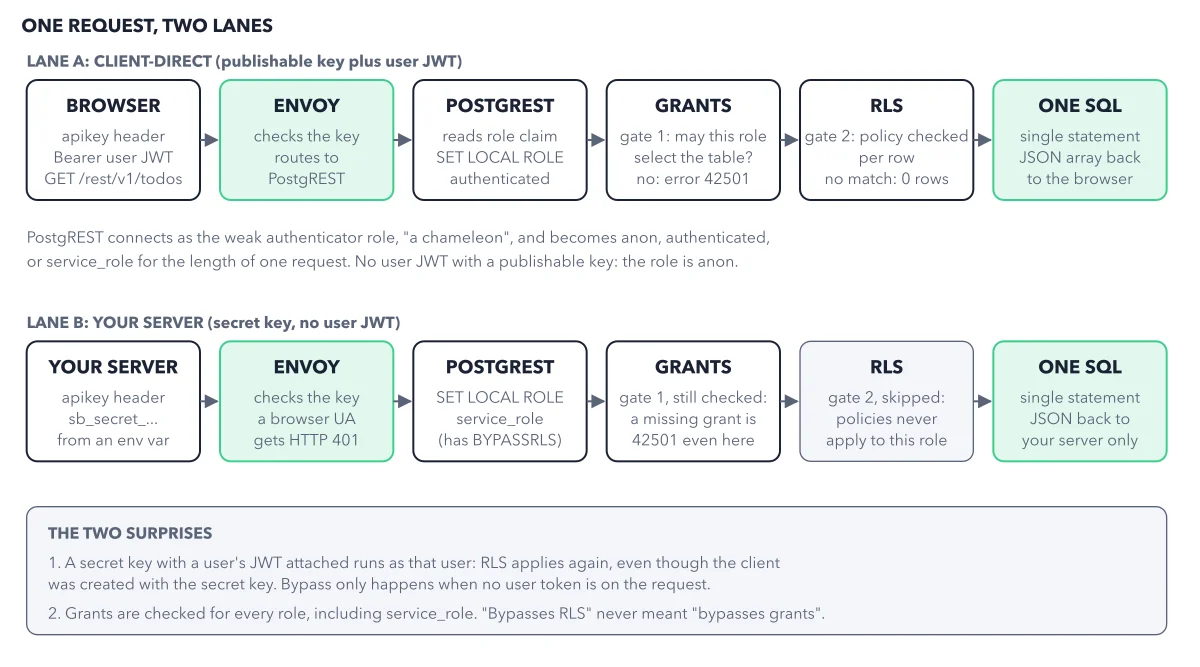
One request, end to end
2026-10-02
DeepSeek
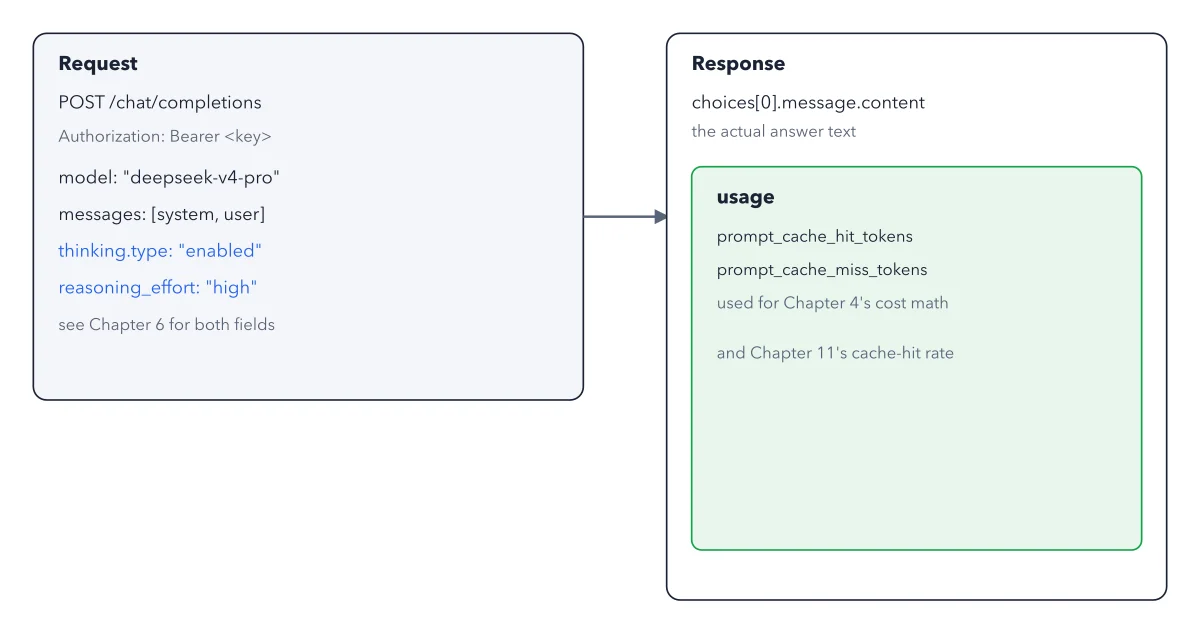
The request and response anatomy of a DeepSeek API call
2026-10-01
GLM
2026-10-01
Mistral
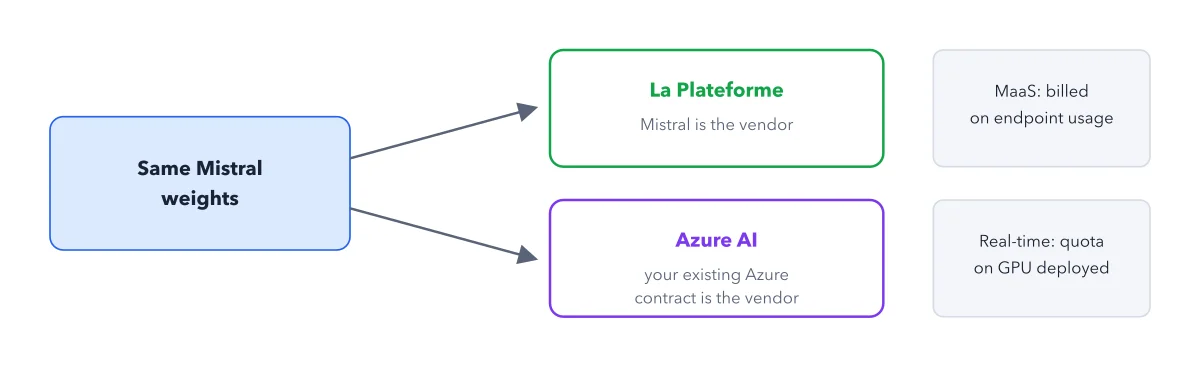
Where Azure fits, the same weights, a fourth path, a different data boundary
2026-10-01
Grok Bot
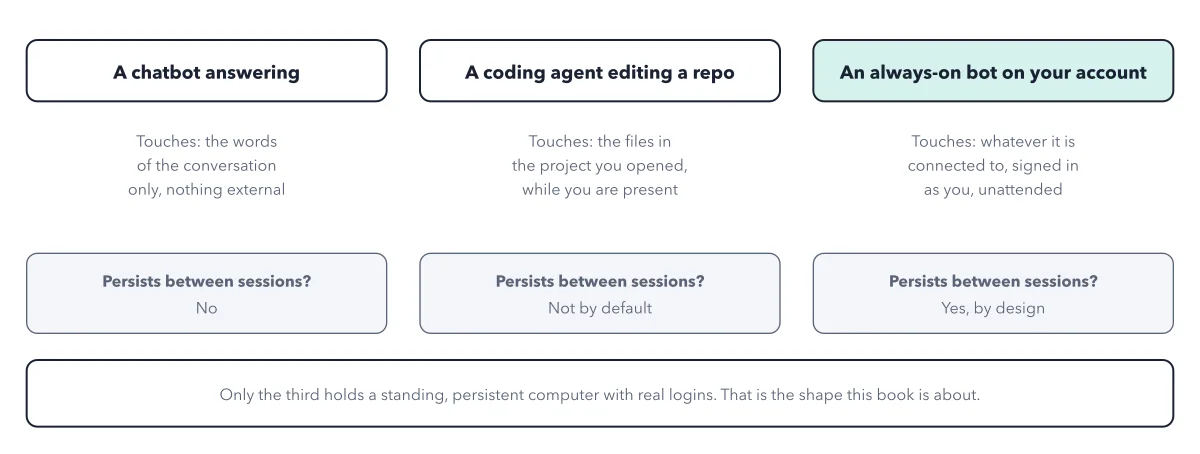
Three shapes of AI help, and what each one can reach
2026-09-30
Llama
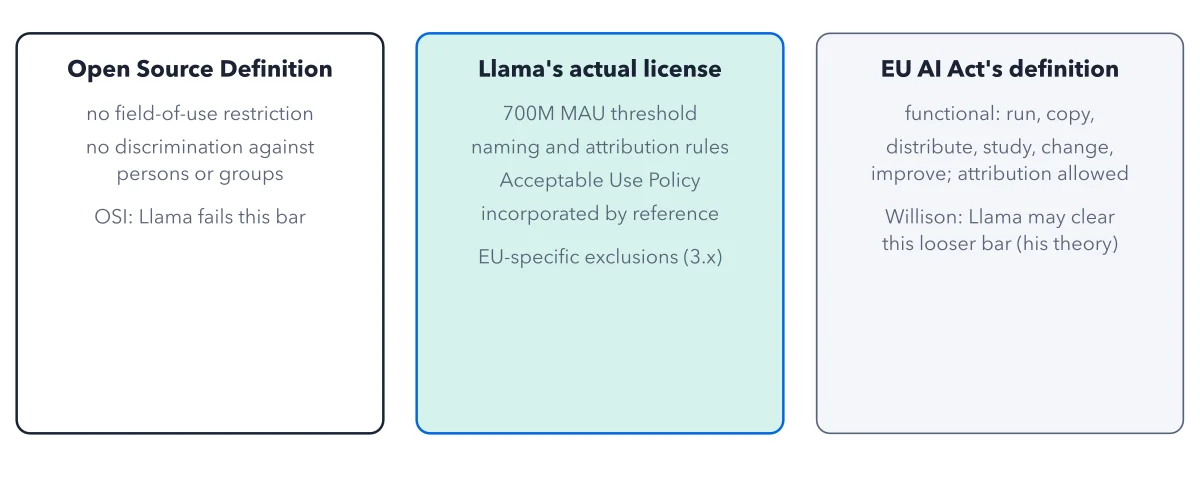
Two definitions of open source, and the license Llama actually ships under
2026-09-30
Qwen
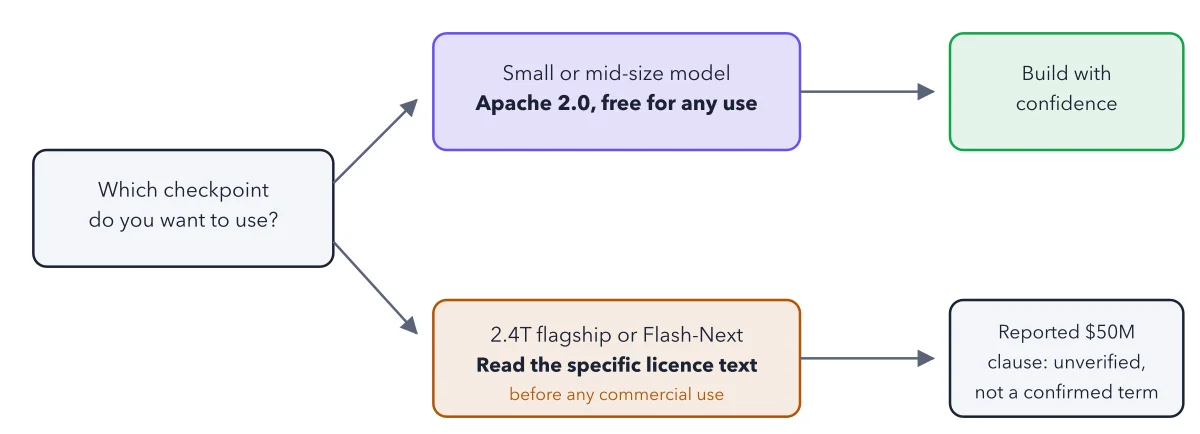
A decision flow for which licence applies
2026-09-30
Fly.io
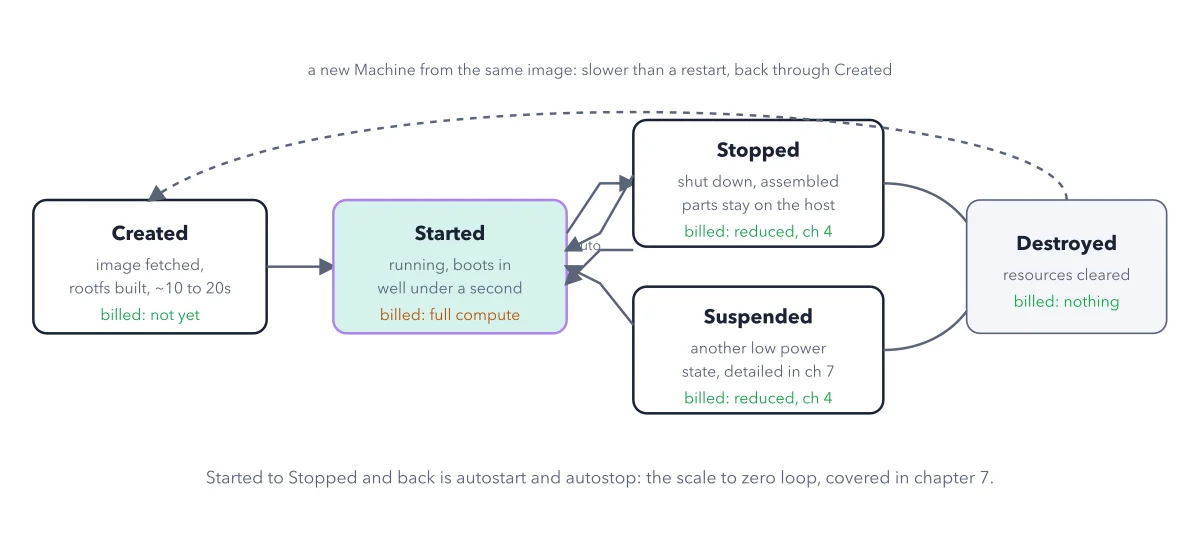
The Machine lifecycle
2026-09-29
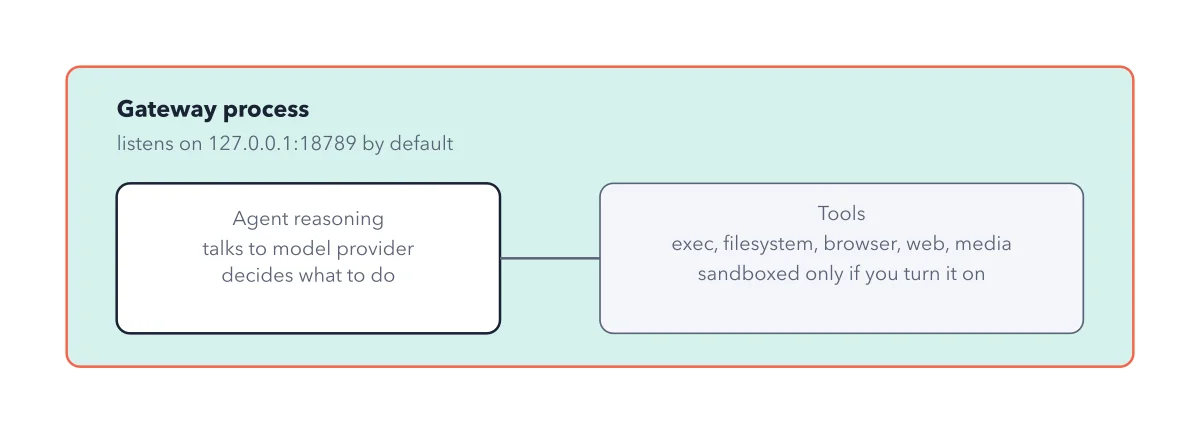
OpenClaw
What runs as whom
2026-09-29
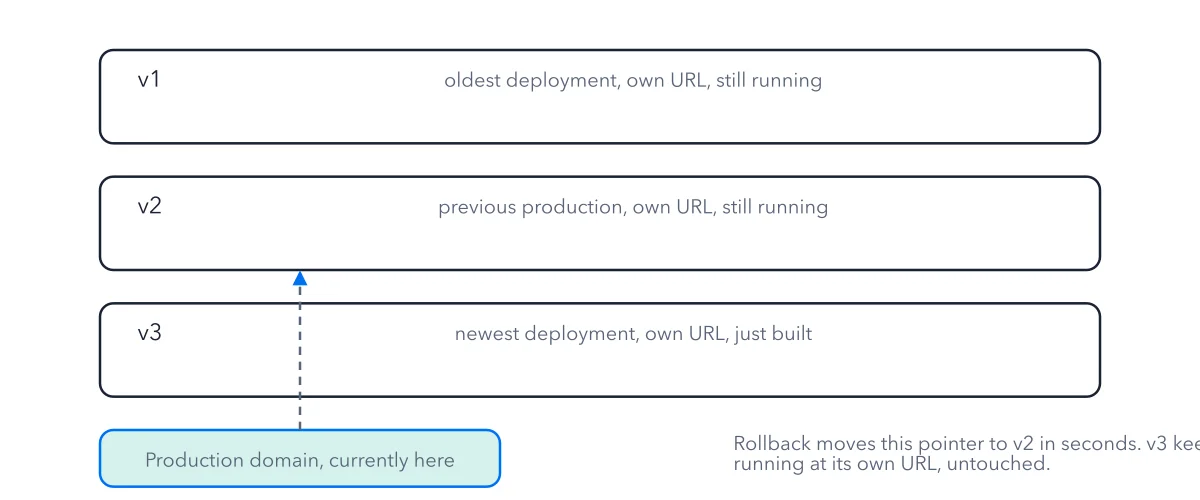
Vercel
Immutability and the alias pointer
2026-09-29
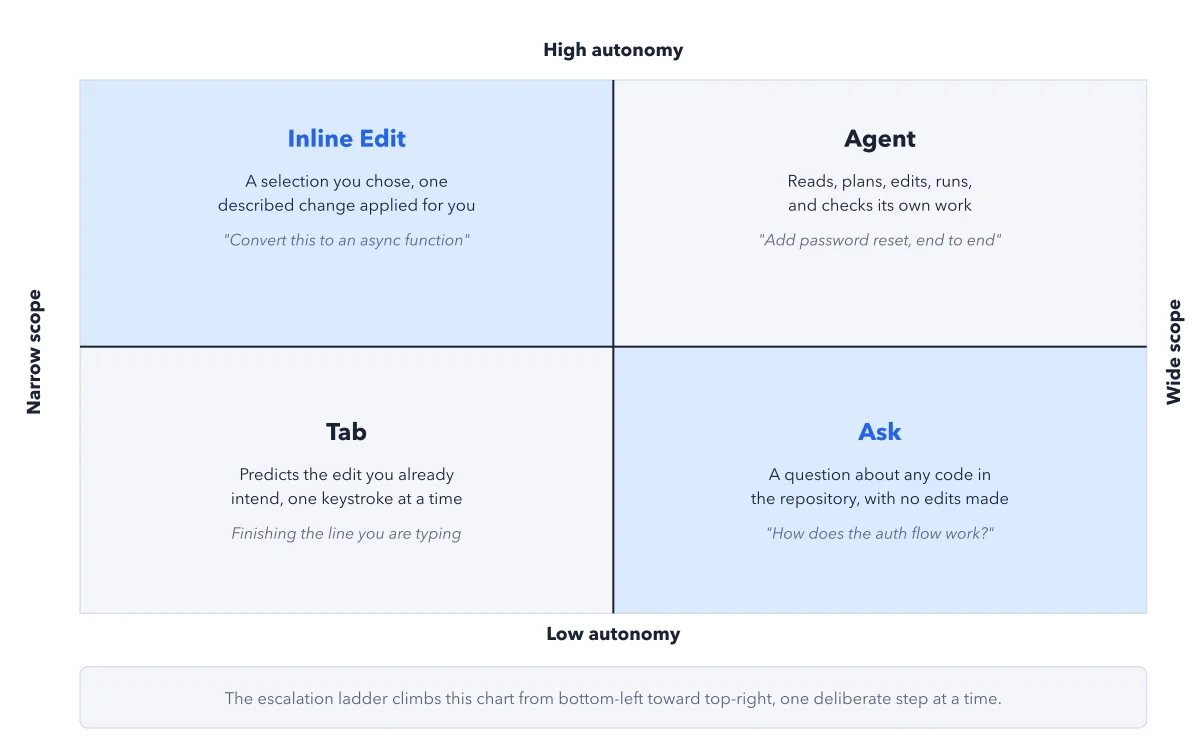
Cursor
The four modes, by scope of change and degree of autonomy
2026-09-28
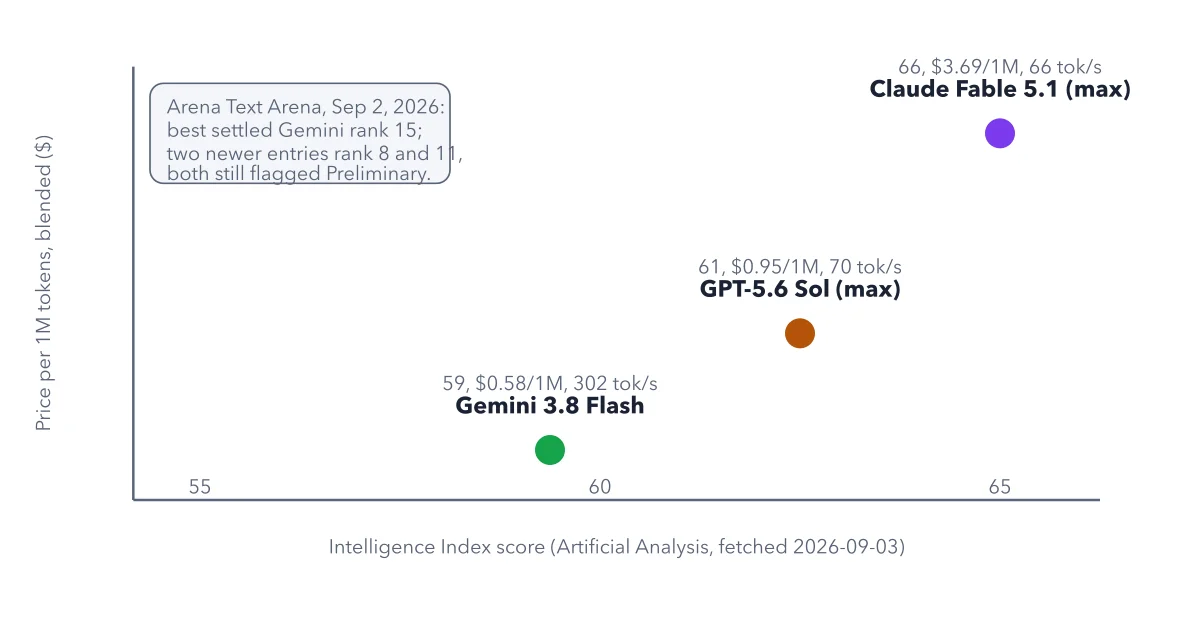
Gemini
Where Gemini sits, dated
2026-09-28
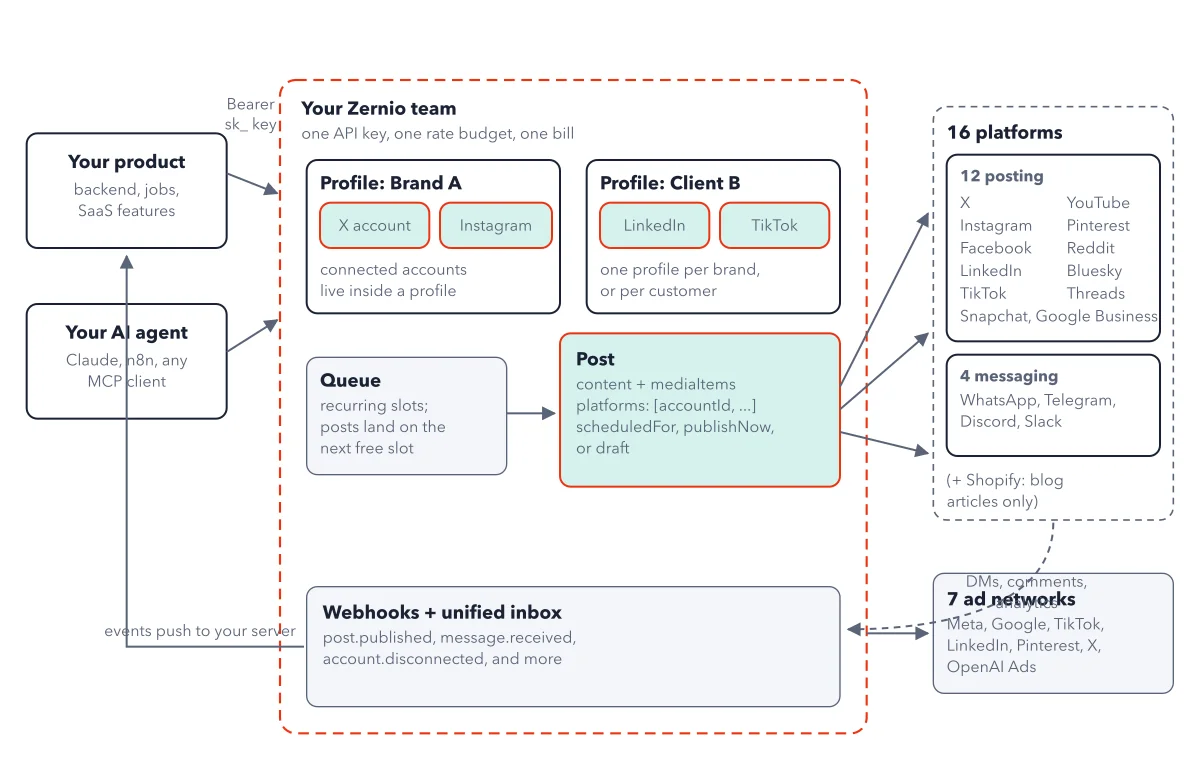
Zernio
The big schema
2026-09-28
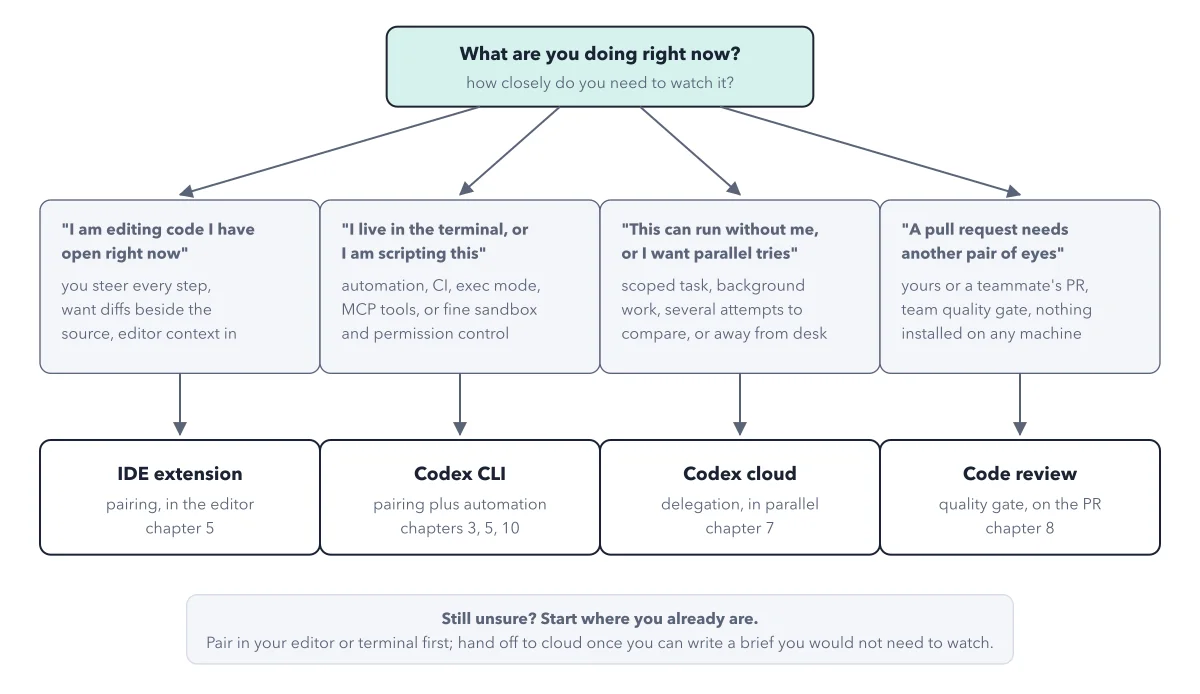
OpenAI Codex
The surface decision map
2026-09-27
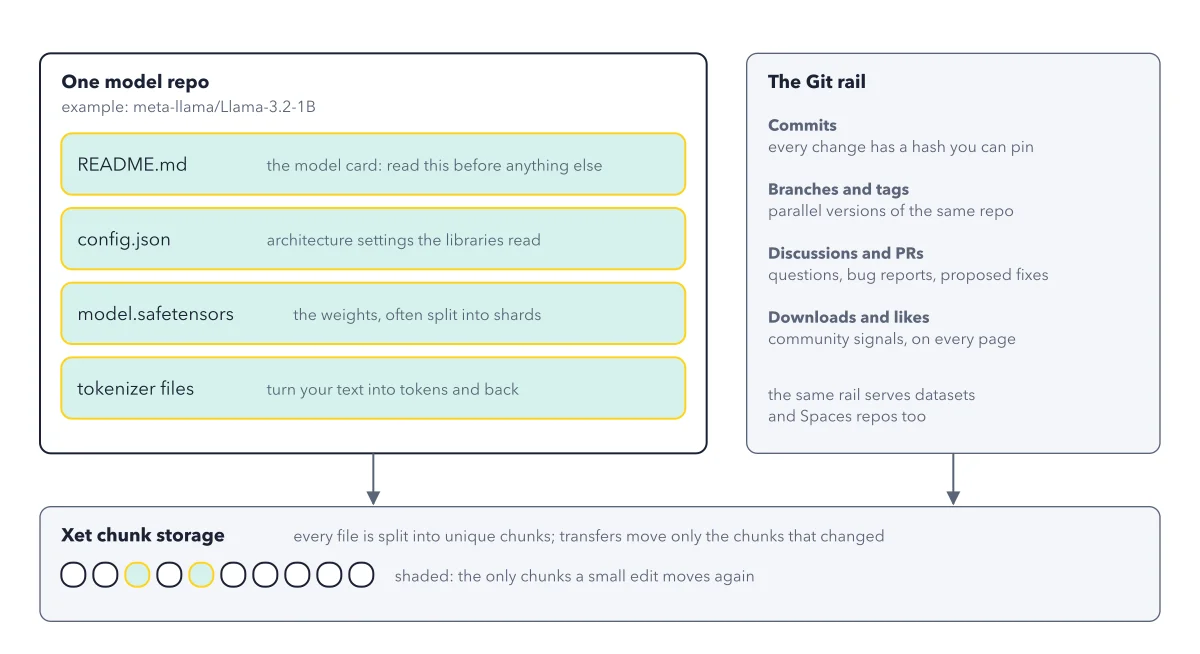
Hugging Face
Inside one model repo
2026-09-27
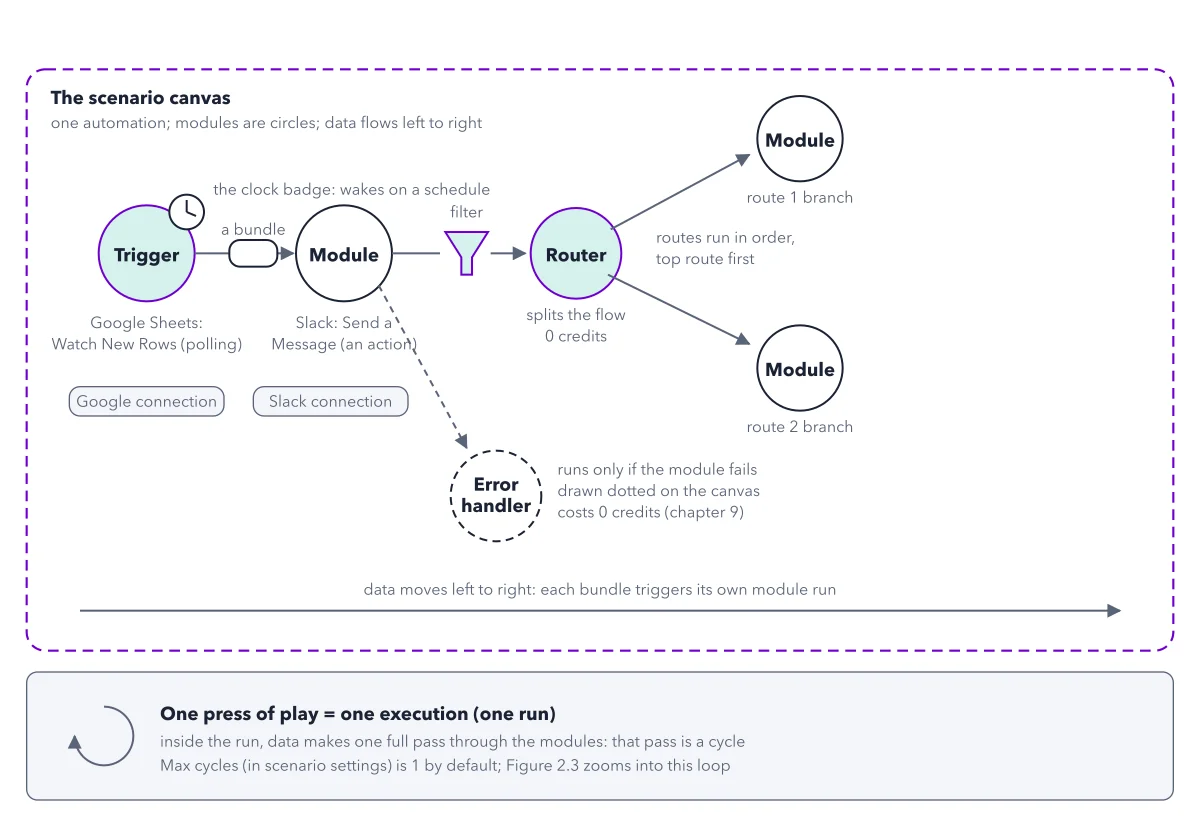
Make.com
The big schema
2026-09-27
Lovable
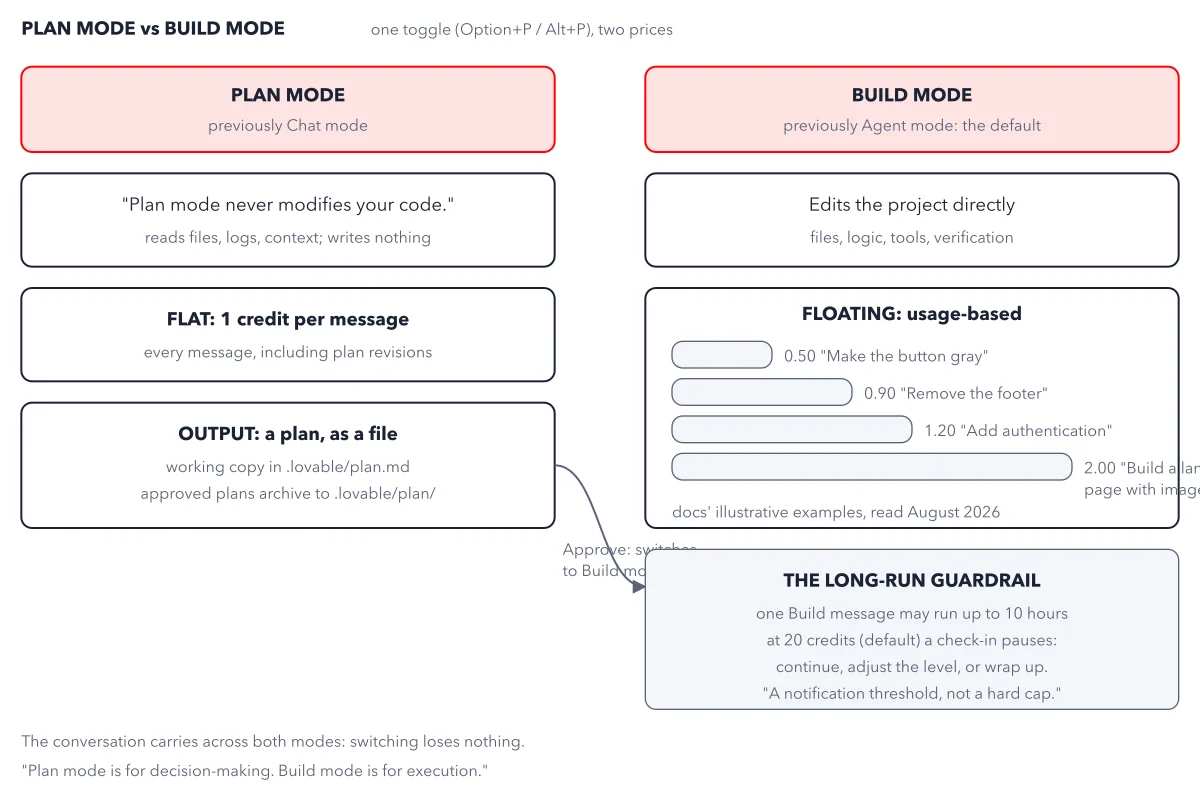
Plan mode vs Build mode
2026-09-26
Modal
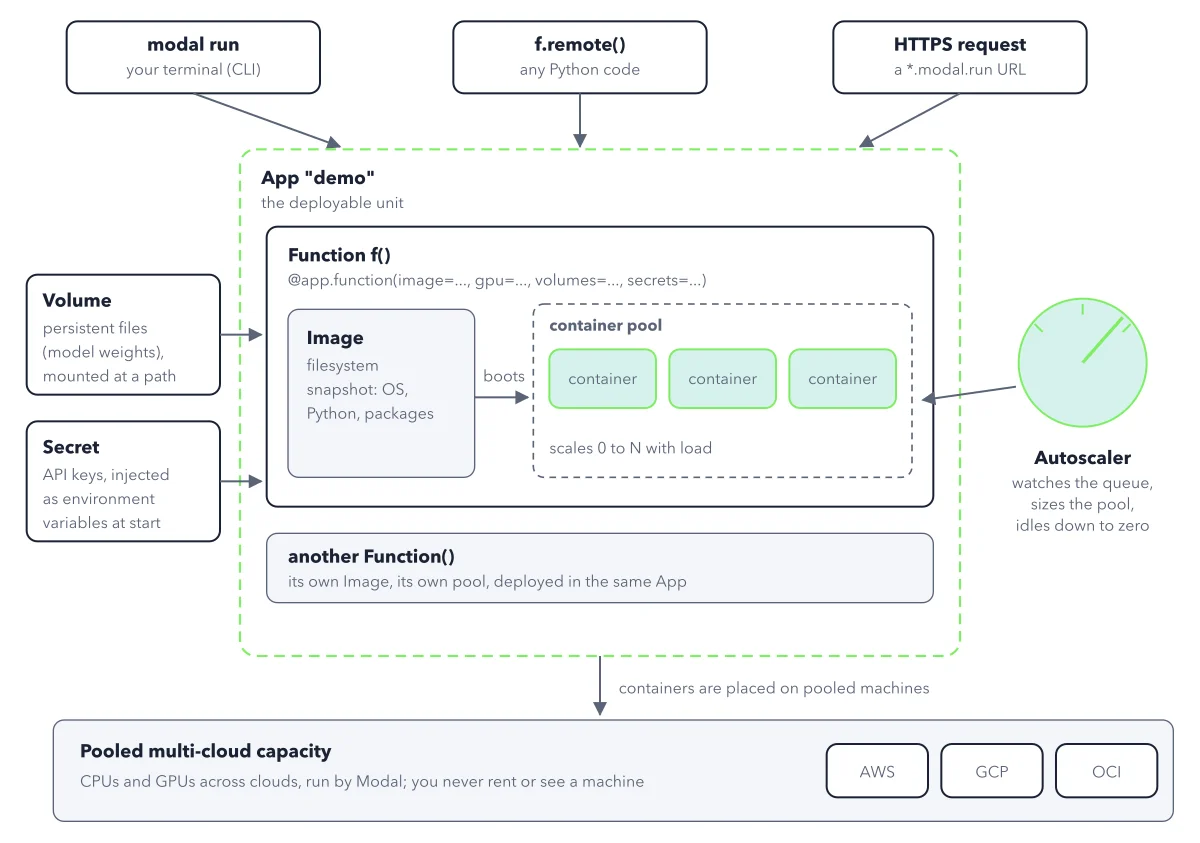
The big schema
2026-09-26
Vapi
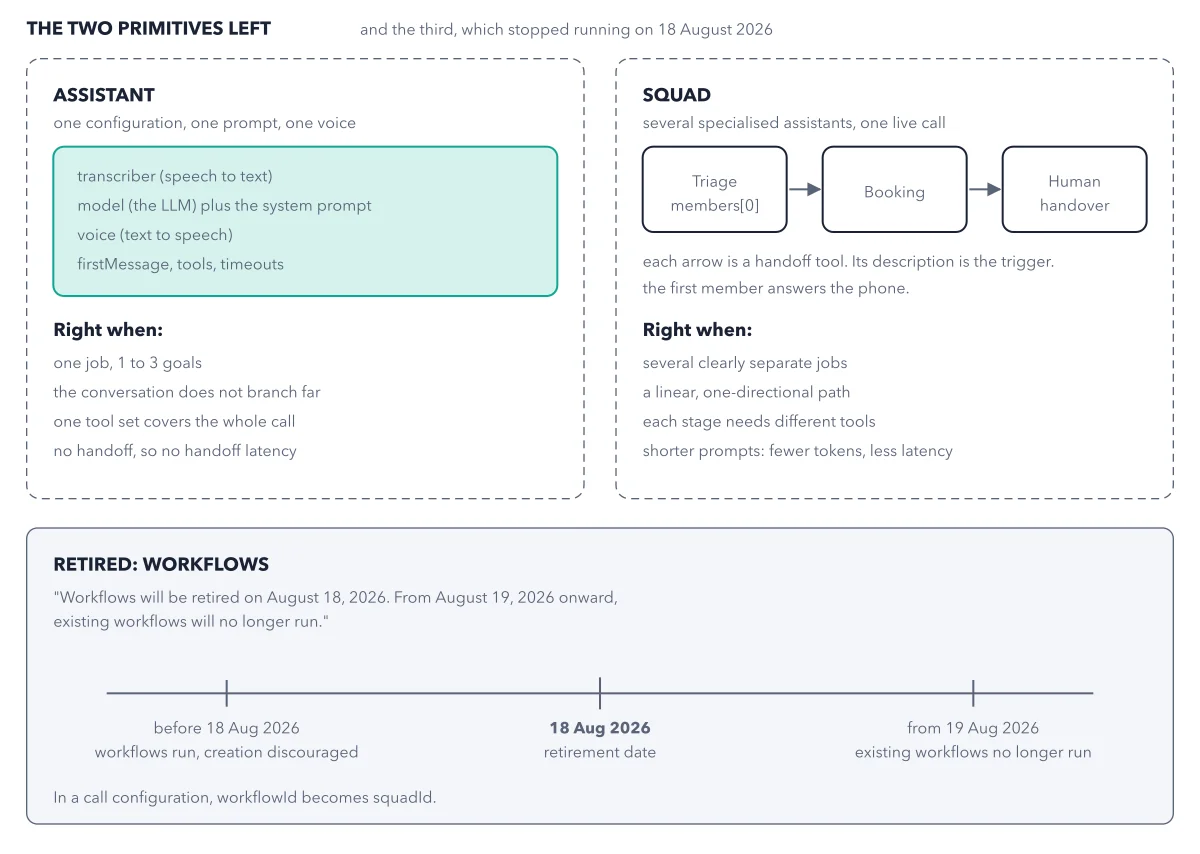
Assistant against squad, with the condition each one suits, and the retirement that...
2026-09-26
AI Agents
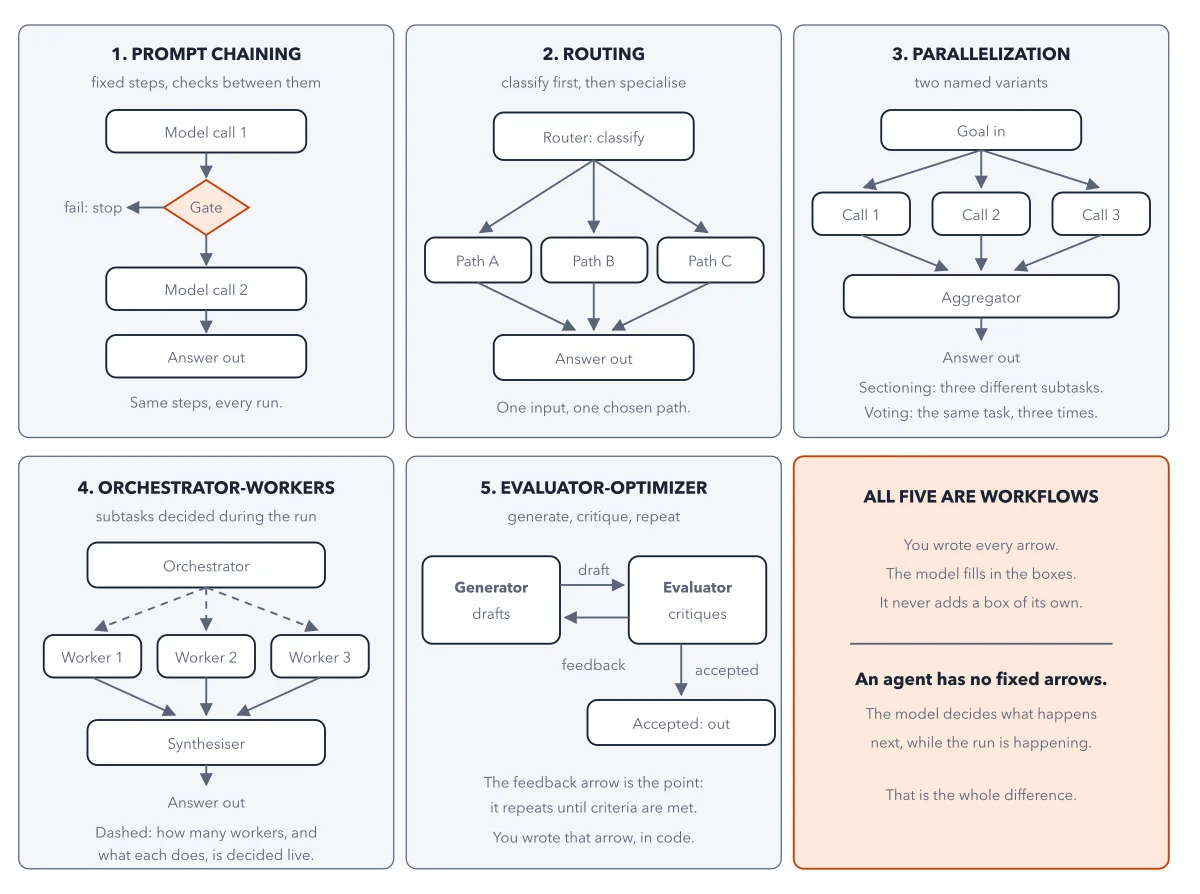
The five workflow patterns from Anthropic's "Building effective agents", at one scale
2026-09-25
GitHub
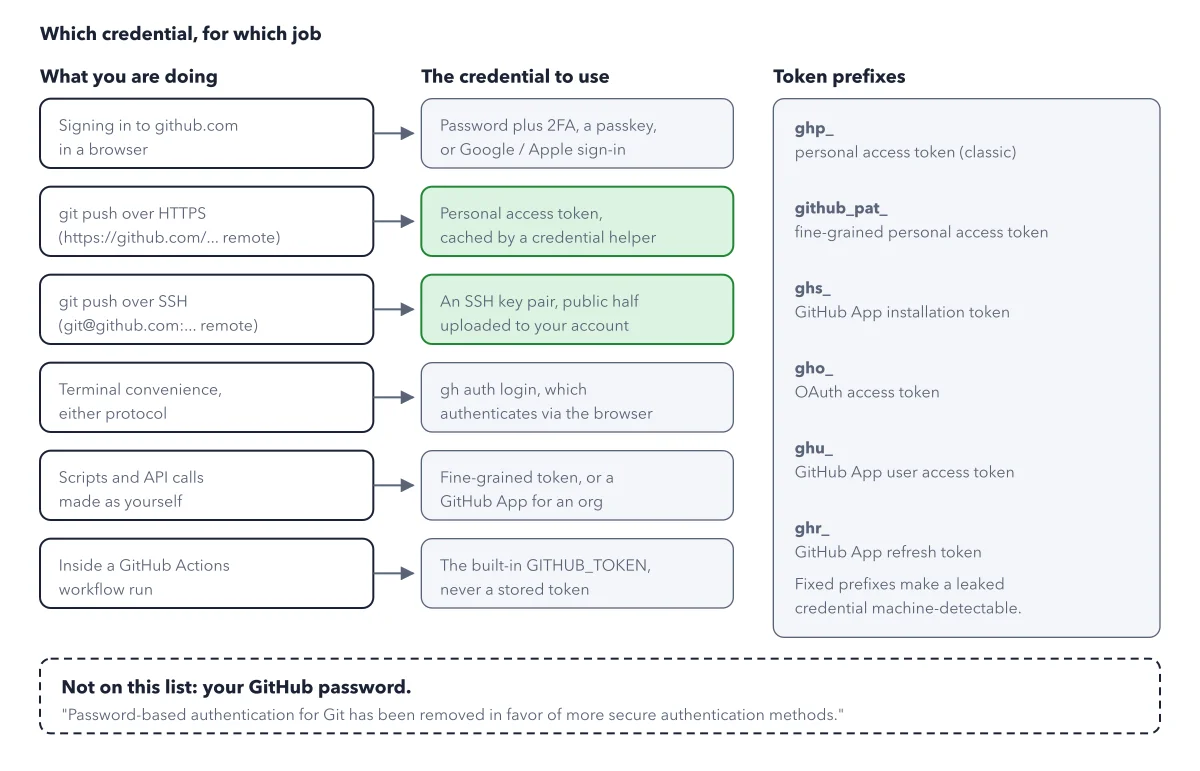
Pick the credential by the job, not by habit
2026-09-25
n8n
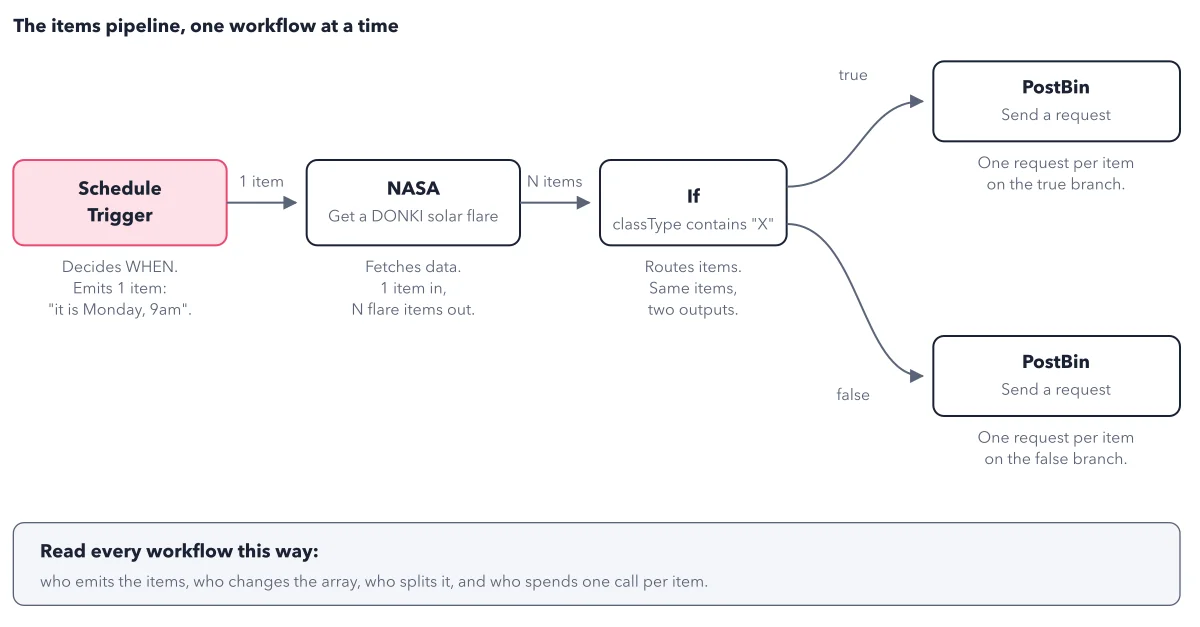
The first workflow annotated
2026-09-25
Docker
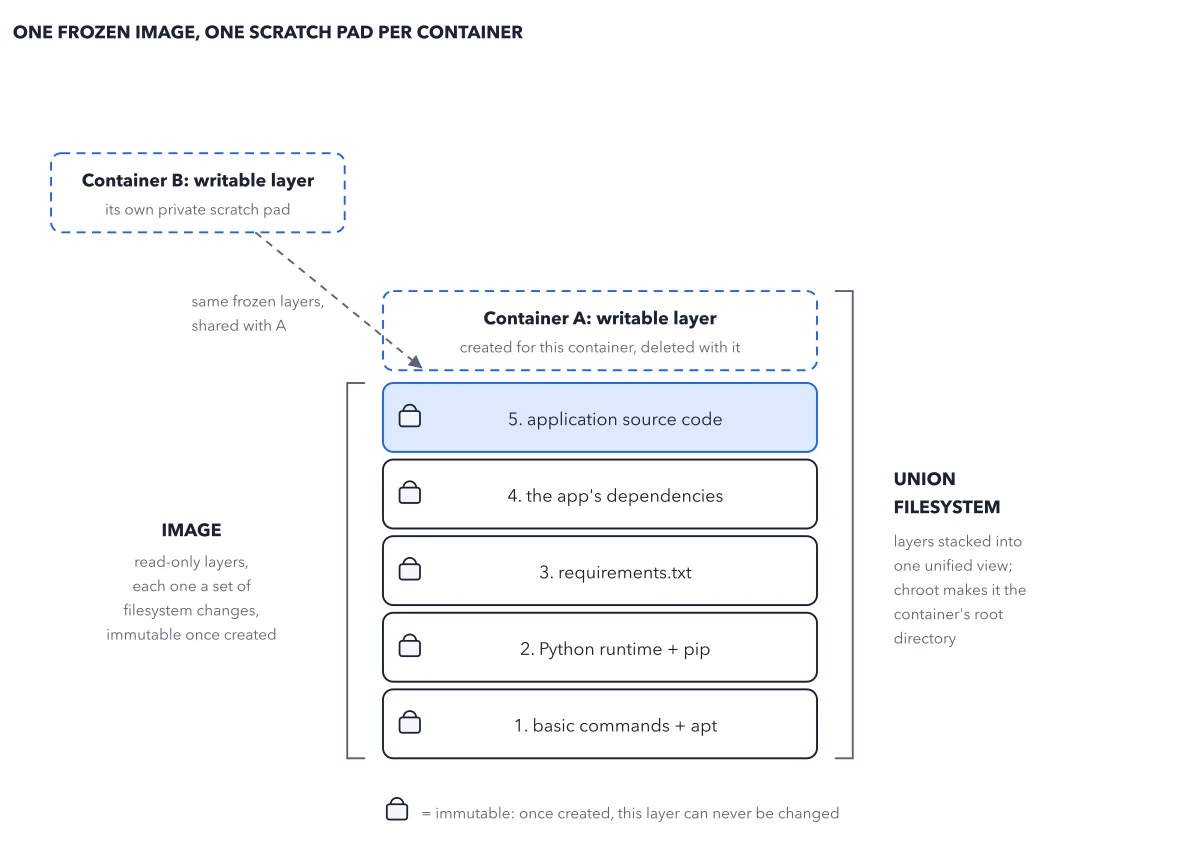
The docs' five-layer Python image, redrawn
2026-09-24
ElevenLabs
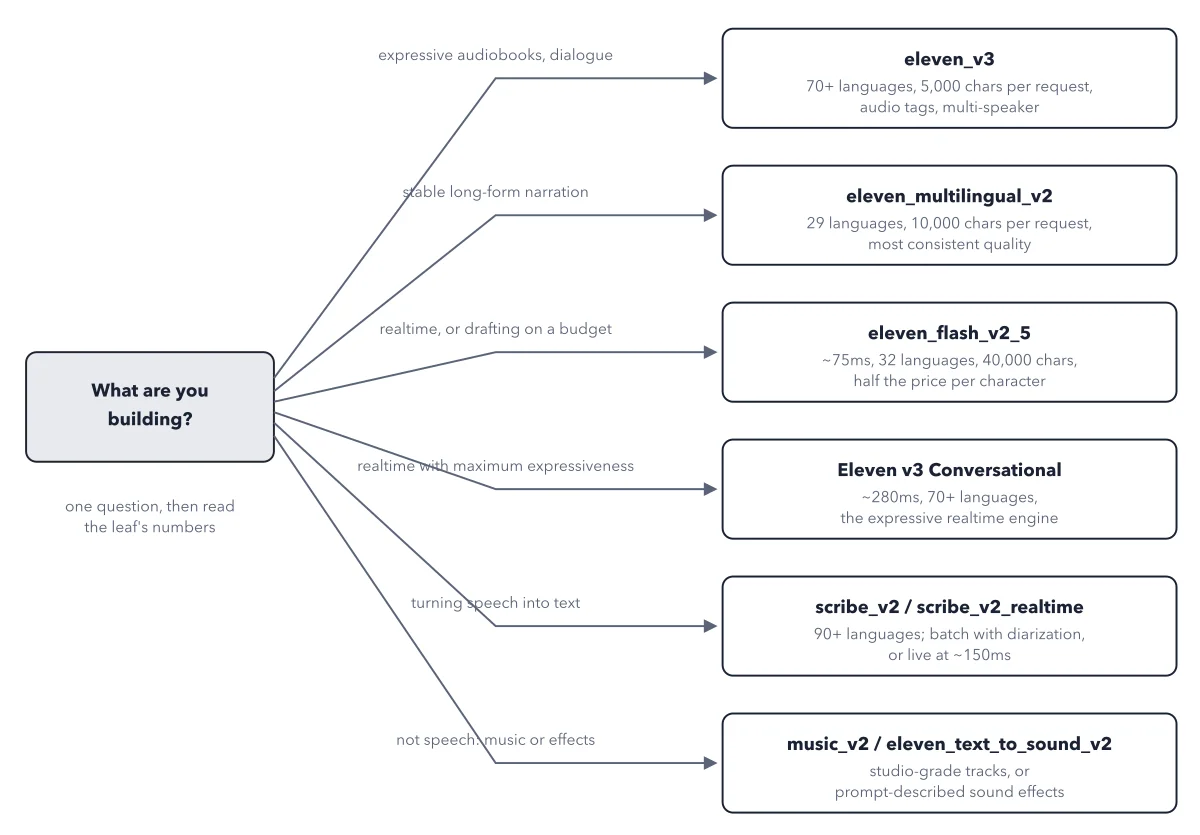
The model picker
2026-09-24
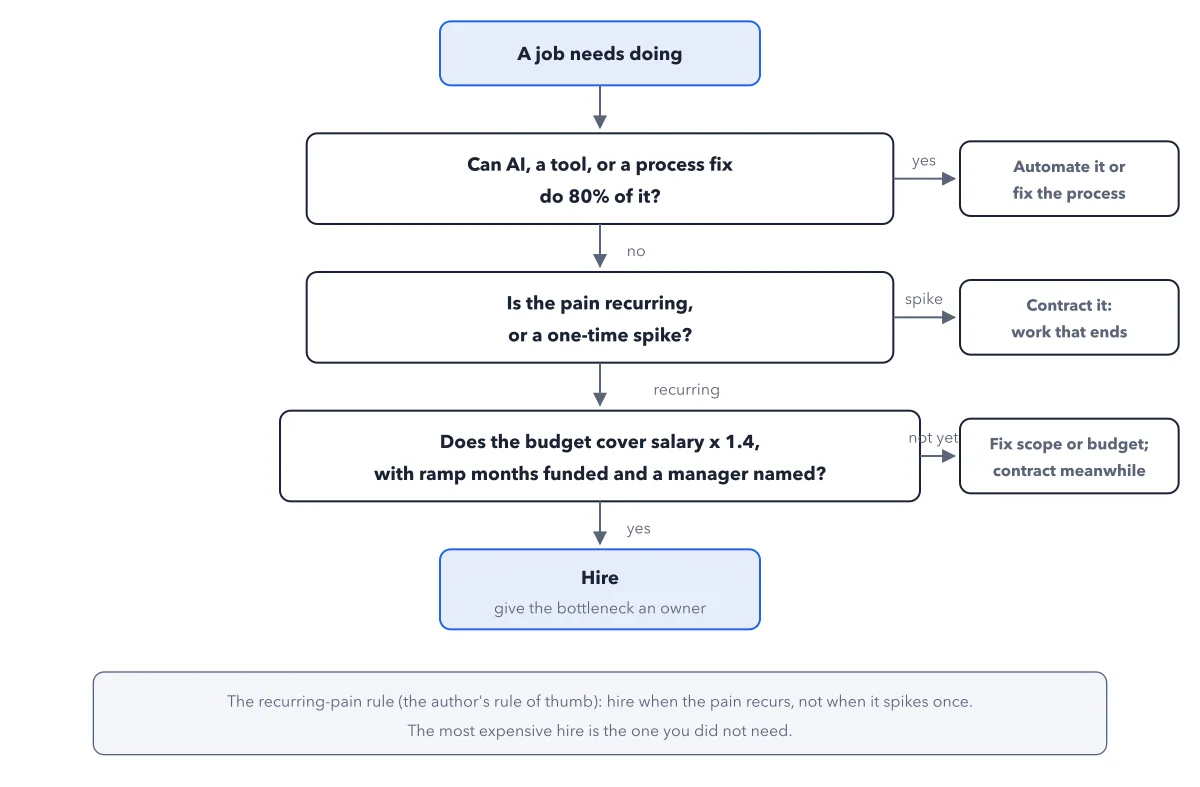
Tech Hiring
The decide gate
2026-09-24
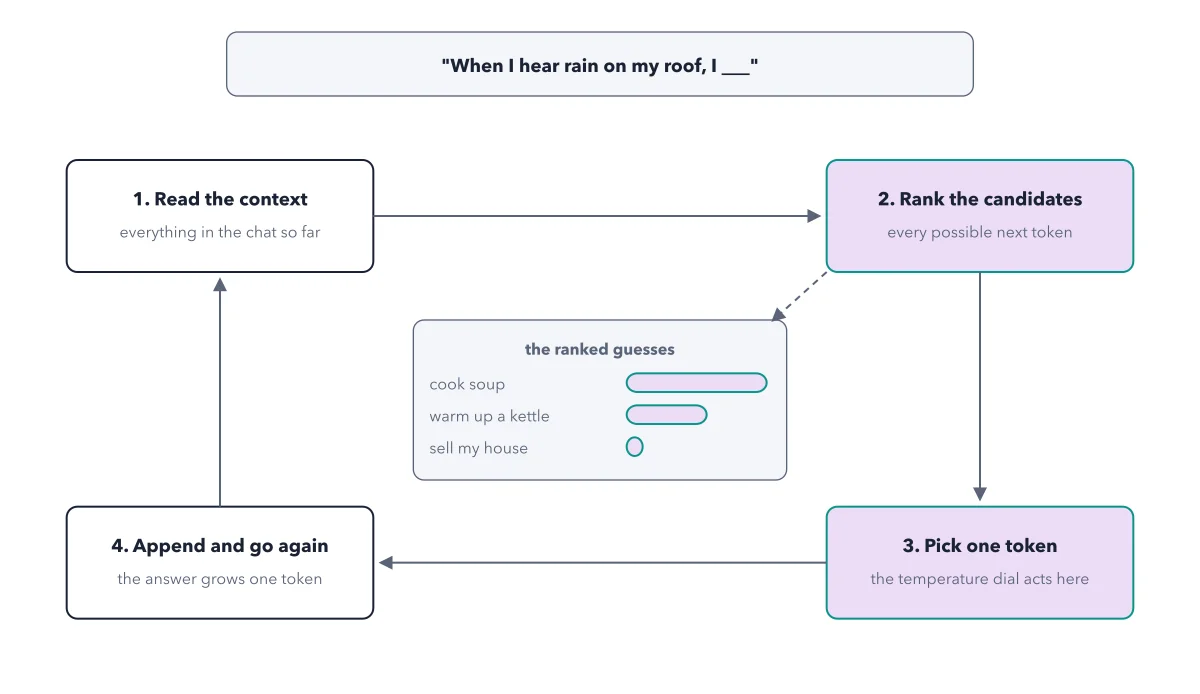
AI
The prediction loop
2026-09-22
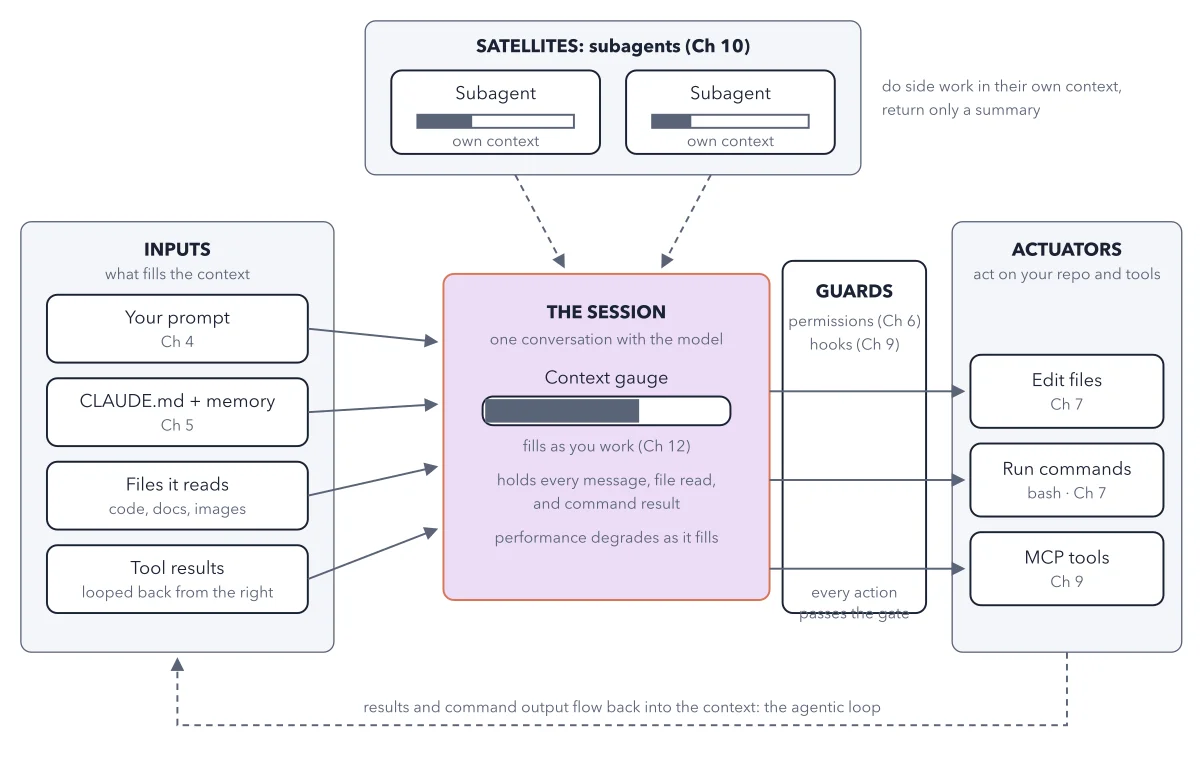
Claude Code
The map of the machine
2026-09-22
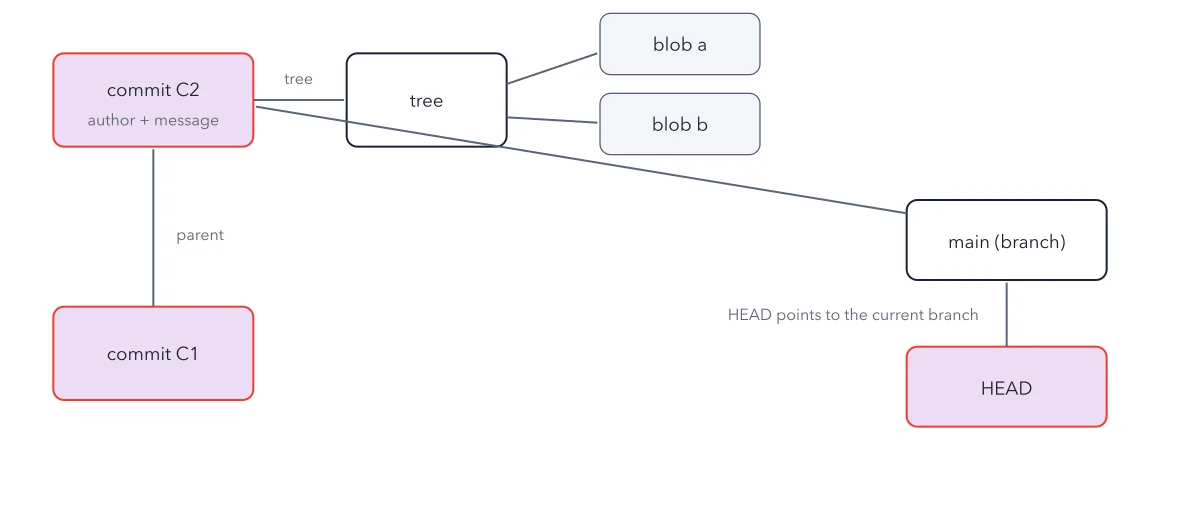
Git
Object model and a small DAG: a commit points to one tree (which points to blobs) and...
2026-09-22
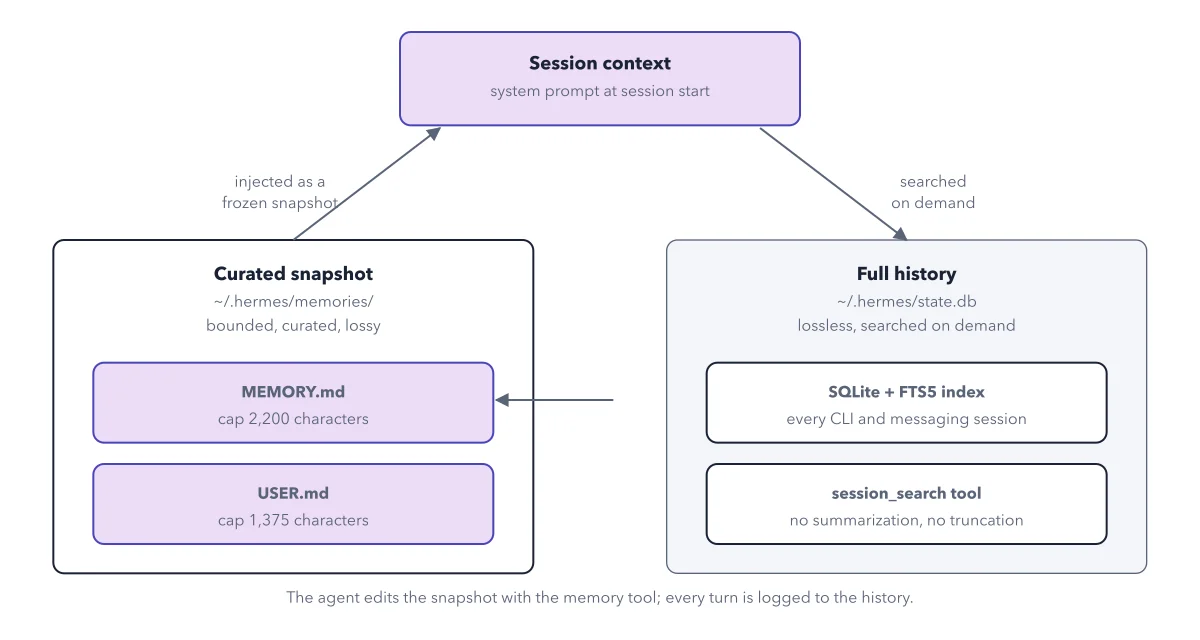
Hermes Agent
The two-store memory model: a small curated snapshot injected into every session,...
2026-09-22
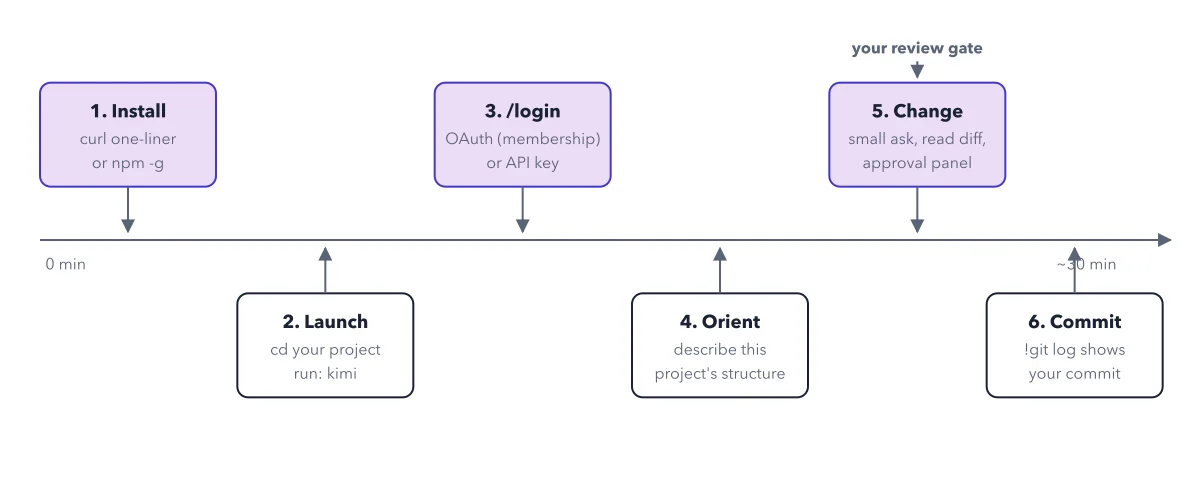
Kimi Code
The zero to first change timeline
2026-09-22
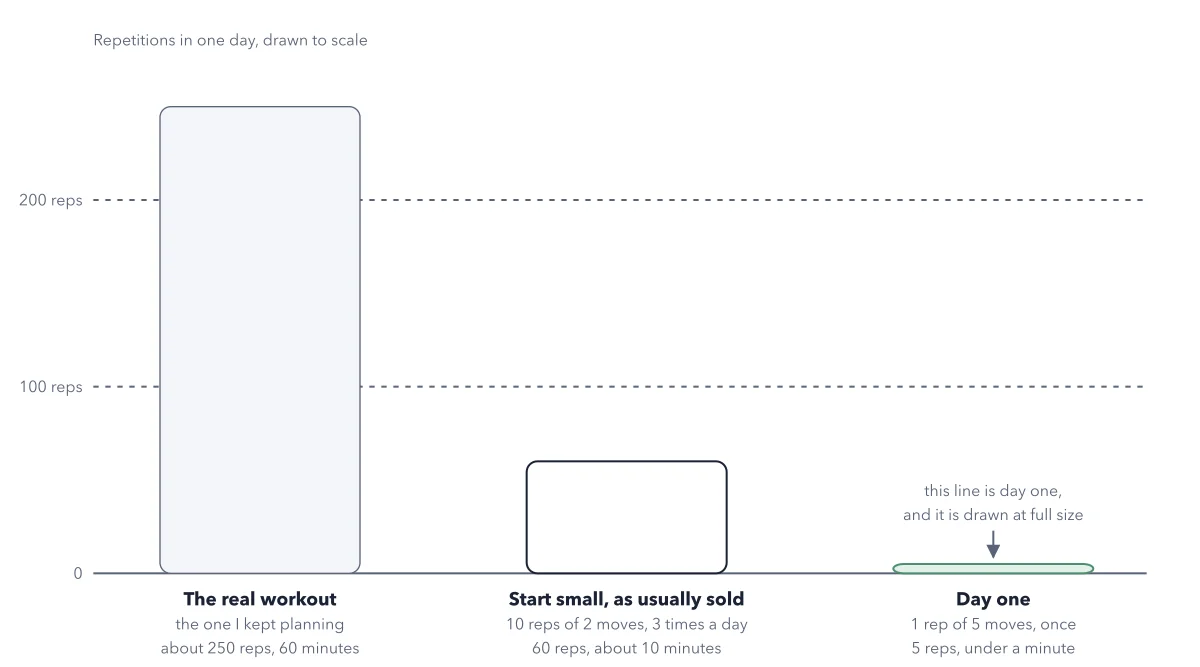
The +1 Method
Day one next to the sessions I never did, at the same scale
2026-09-22
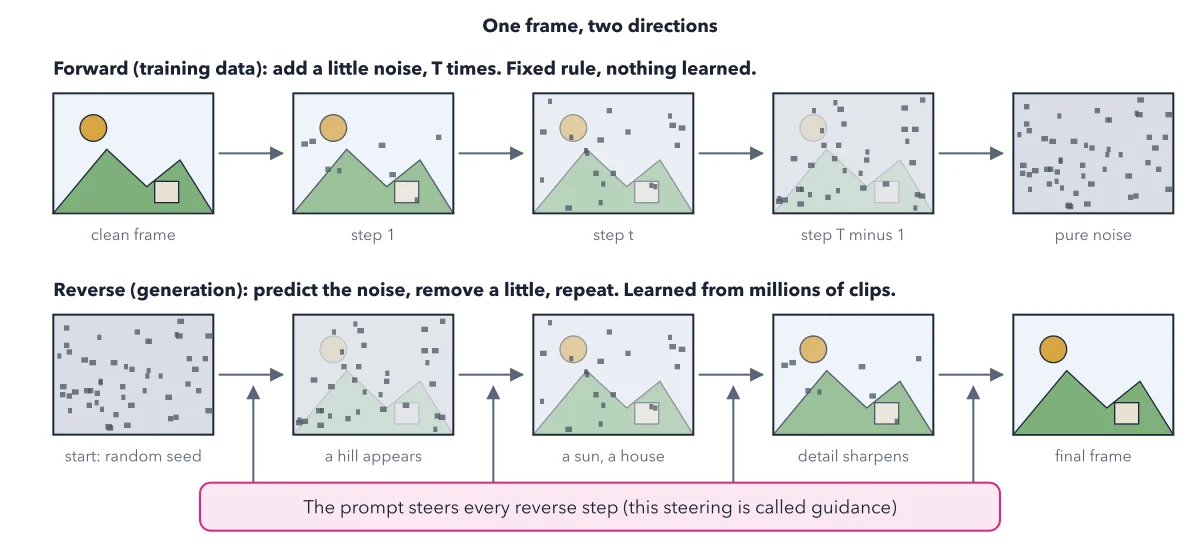
AI Video
Forward and reverse diffusion on one frame
2026-09-21
Jev
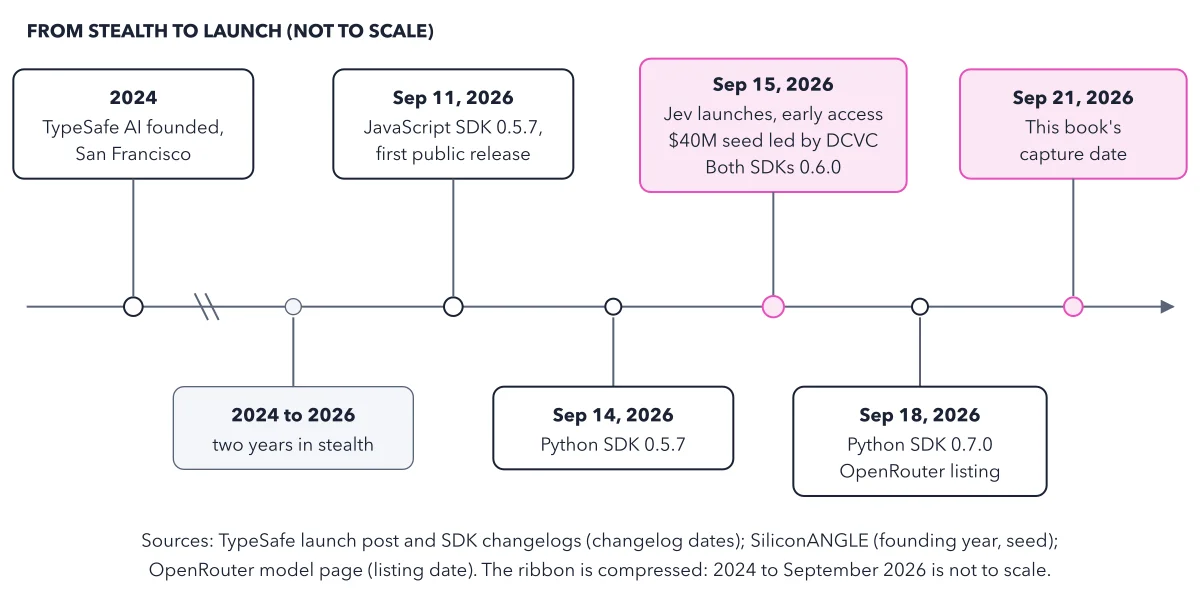
Jev's launch timeline, from founding in 2024 to this book's capture date
2026-09-21
Supabase
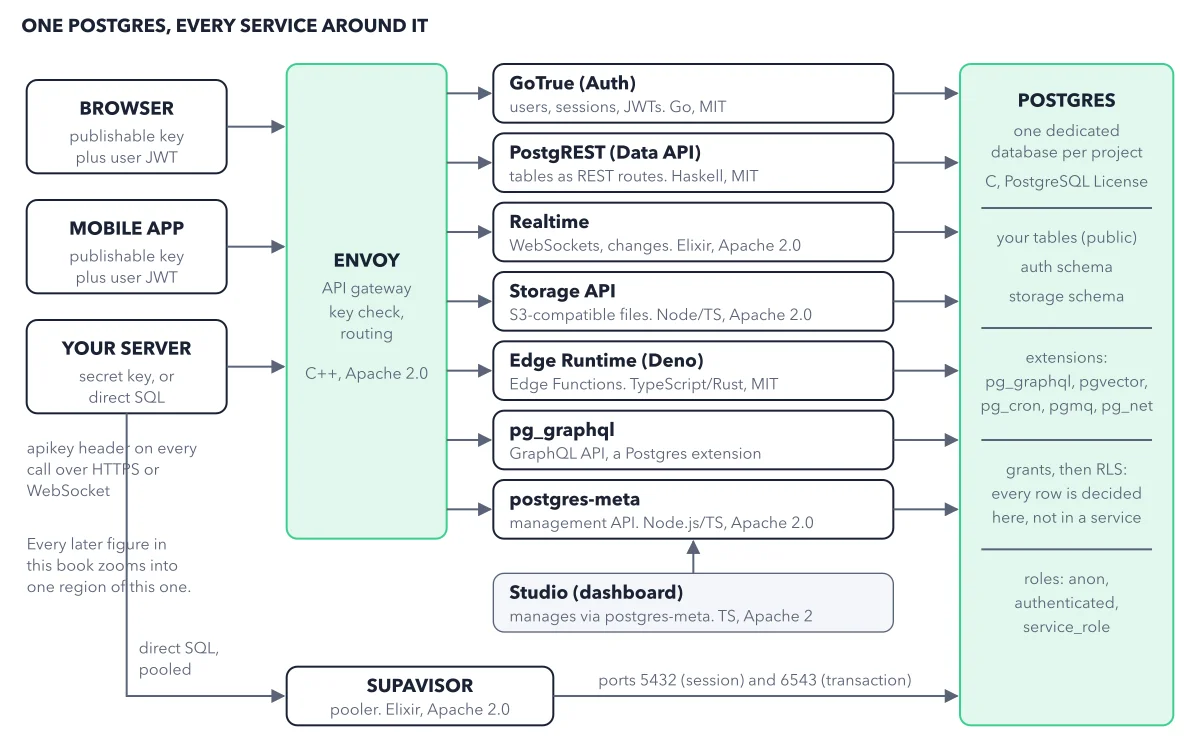
The big schema
2026-09-21
GLM
2026-09-20
Mistral
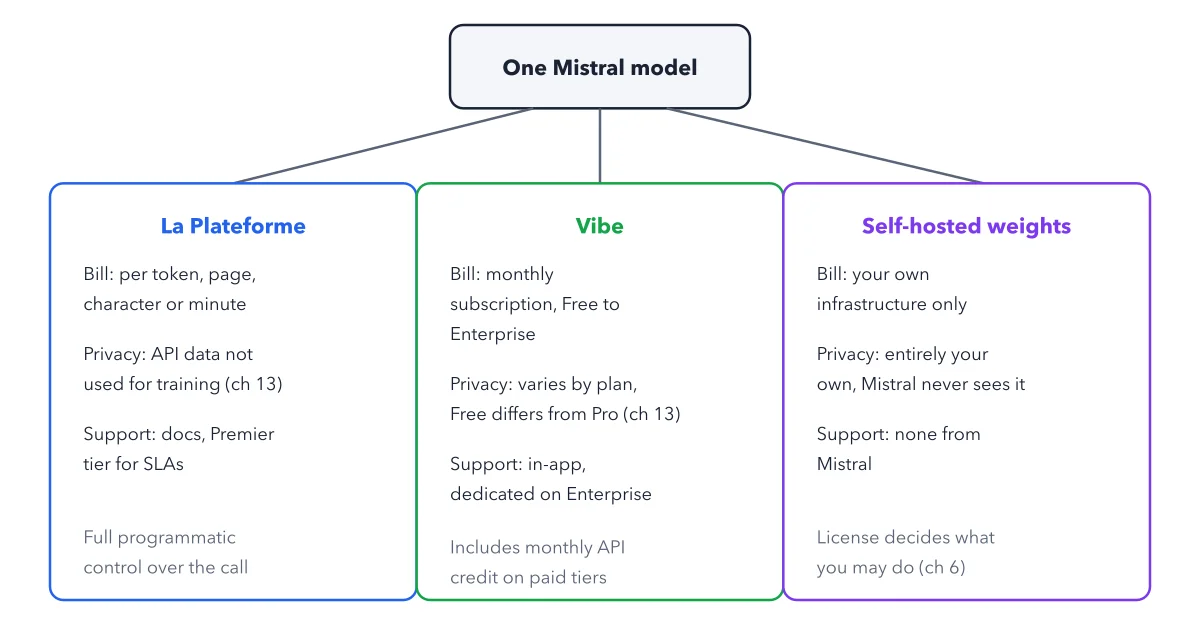
The three-path map, with billing unit, privacy default and support level marked on...
2026-09-20
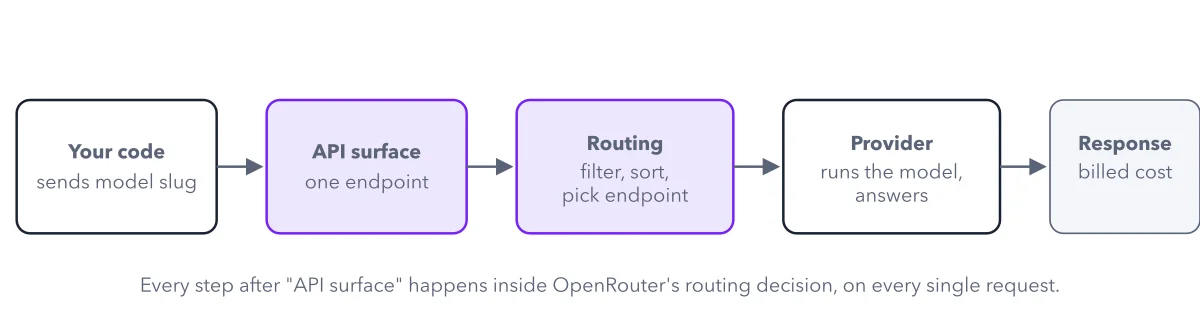
OpenRouter
The big schema
2026-09-20
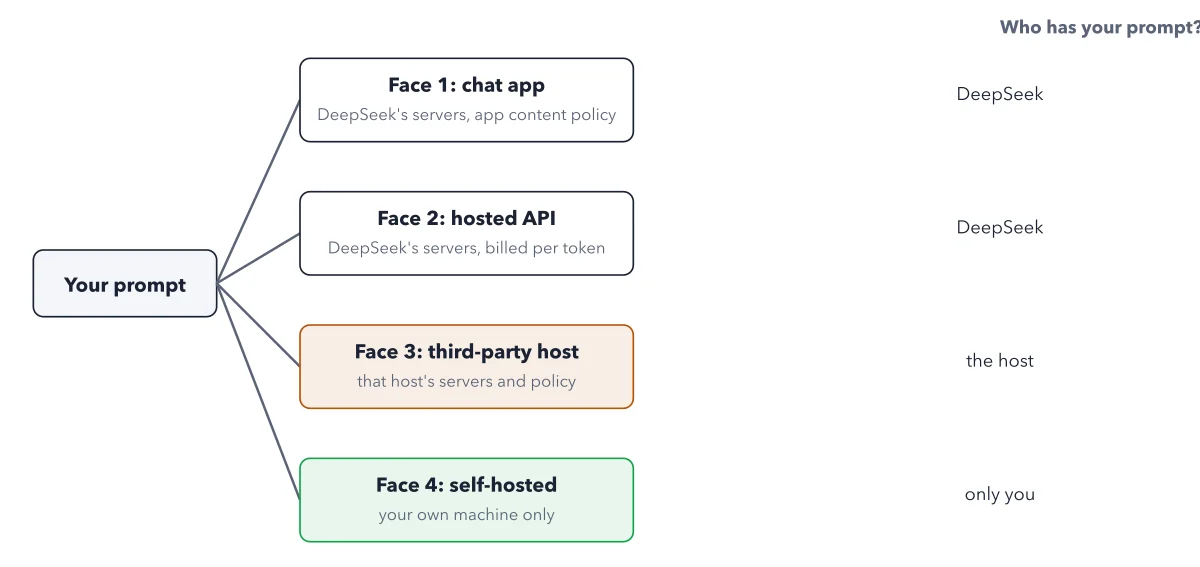
DeepSeek
The same prompt, four paths
2026-09-19
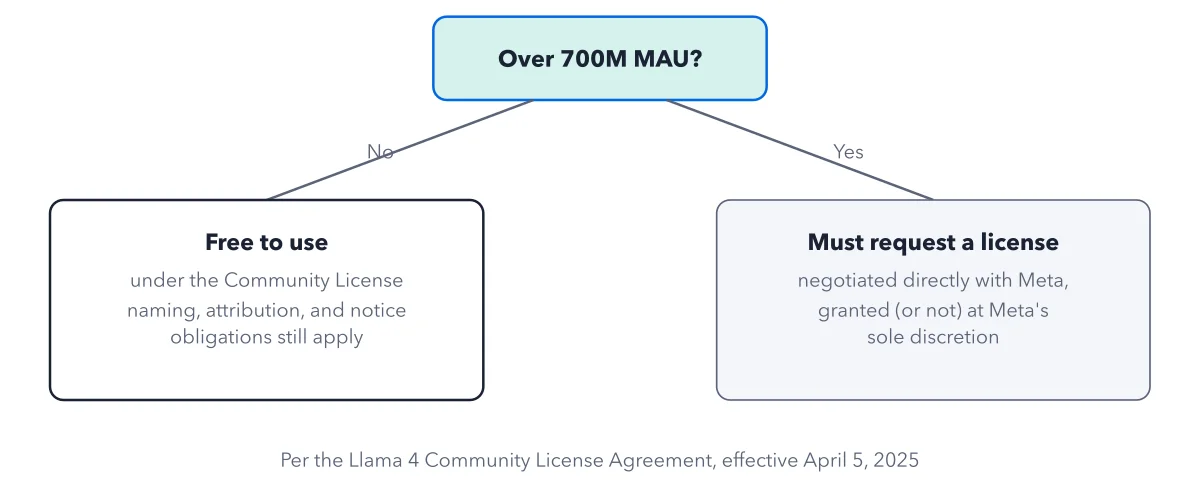
Llama
The decision path from the license's own 700 million MAU clause
2026-09-19
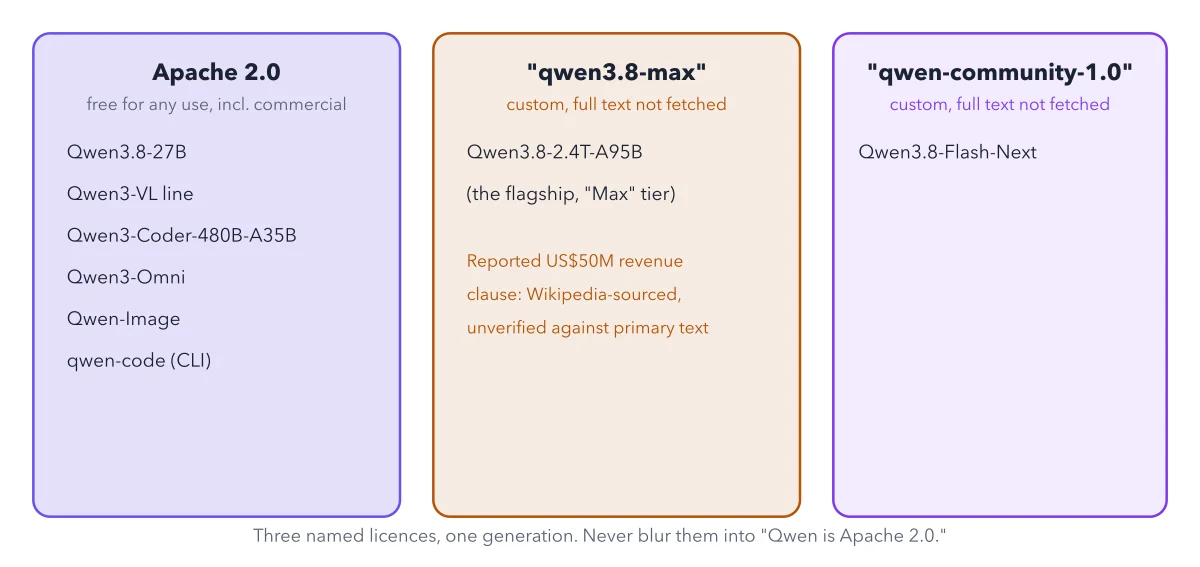
Qwen
The model-to-licence map
2026-09-19
Fly.io
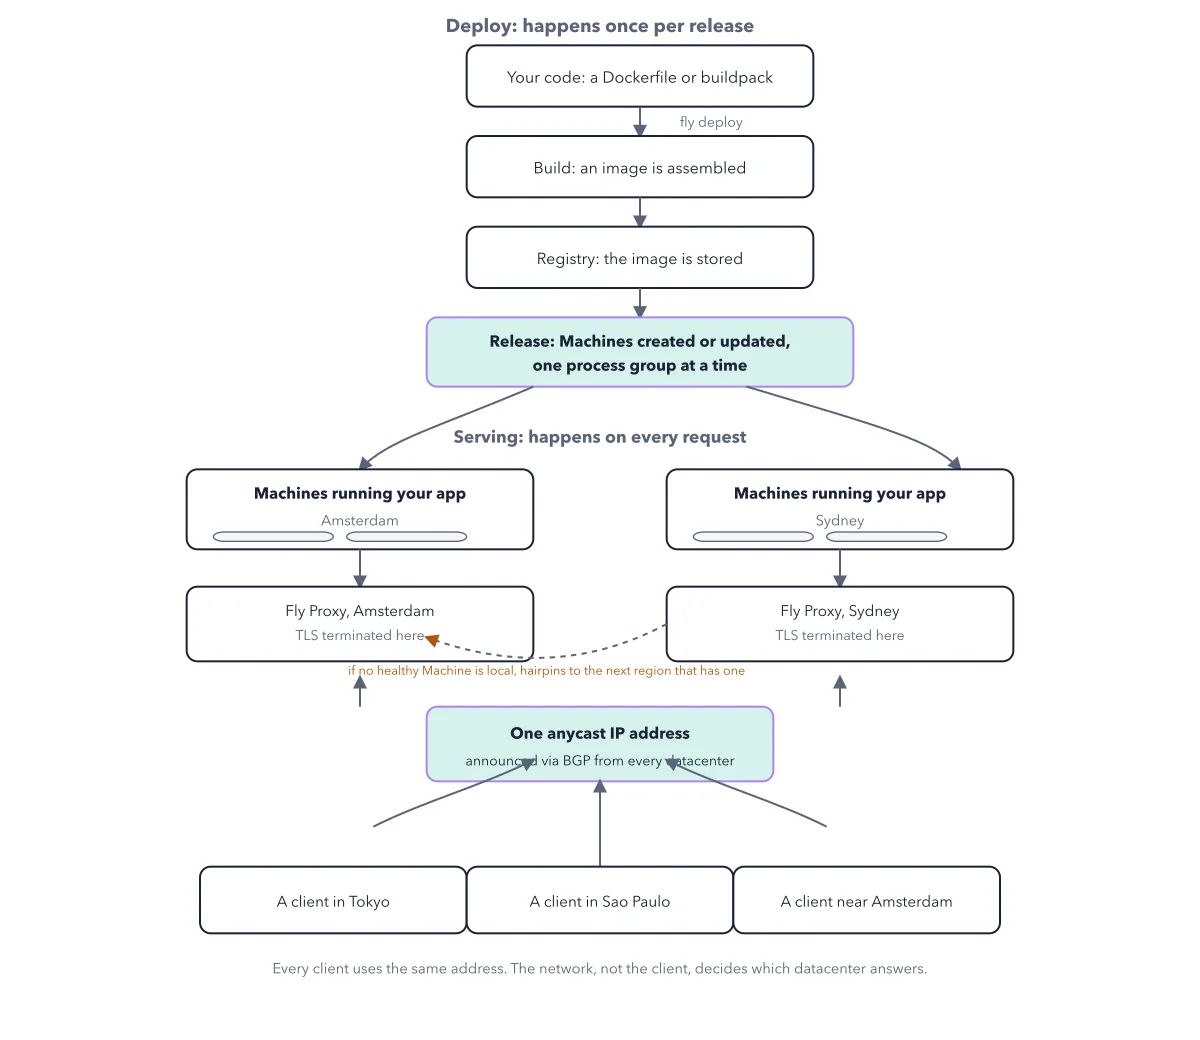
The full path from local code to a served request
2026-09-18
Grok Bot
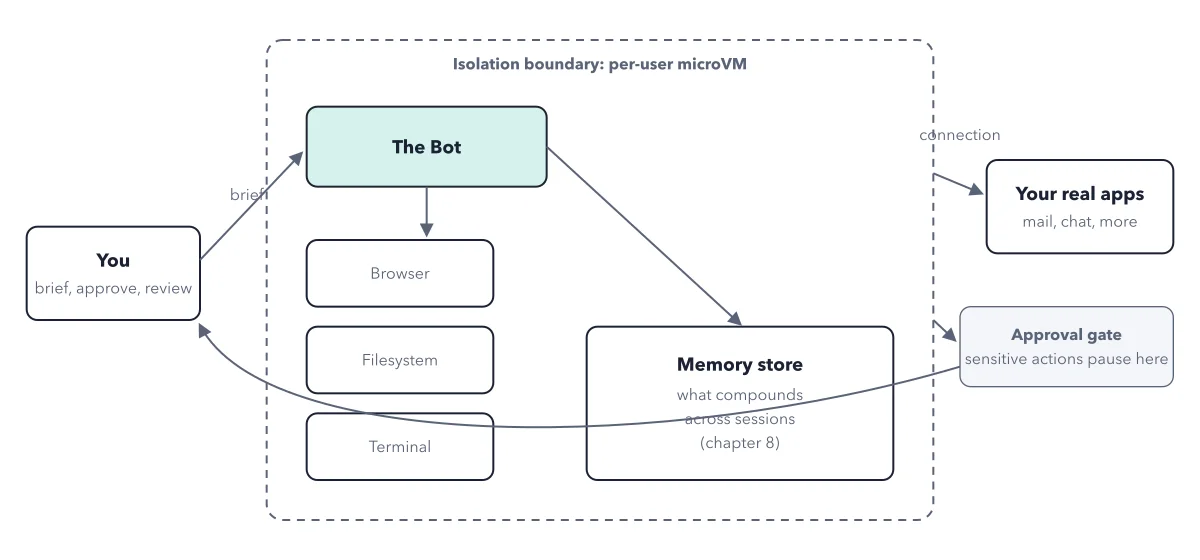
The big schema
2026-09-18
OpenClaw
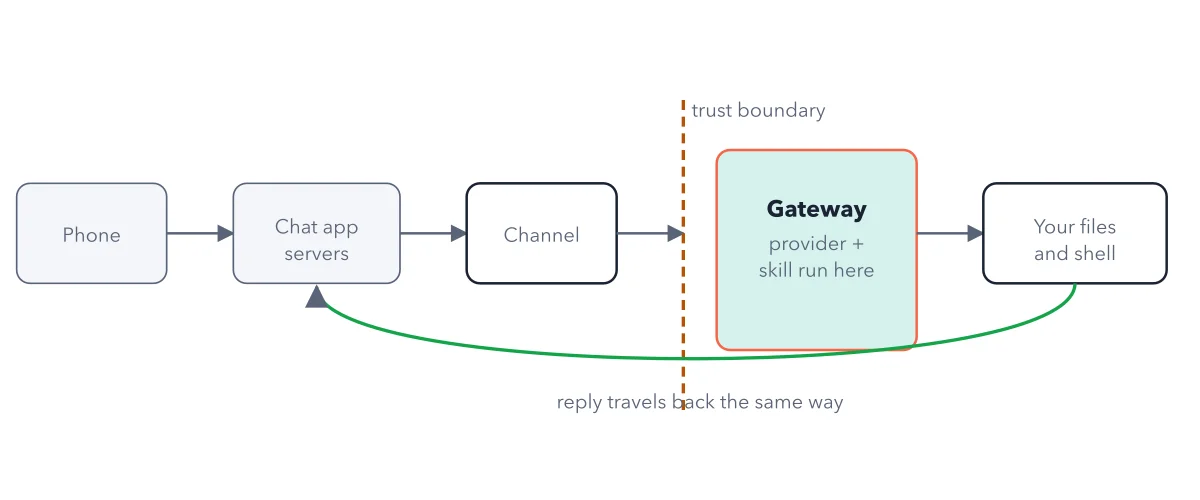
The message path
2026-09-18
Cursor
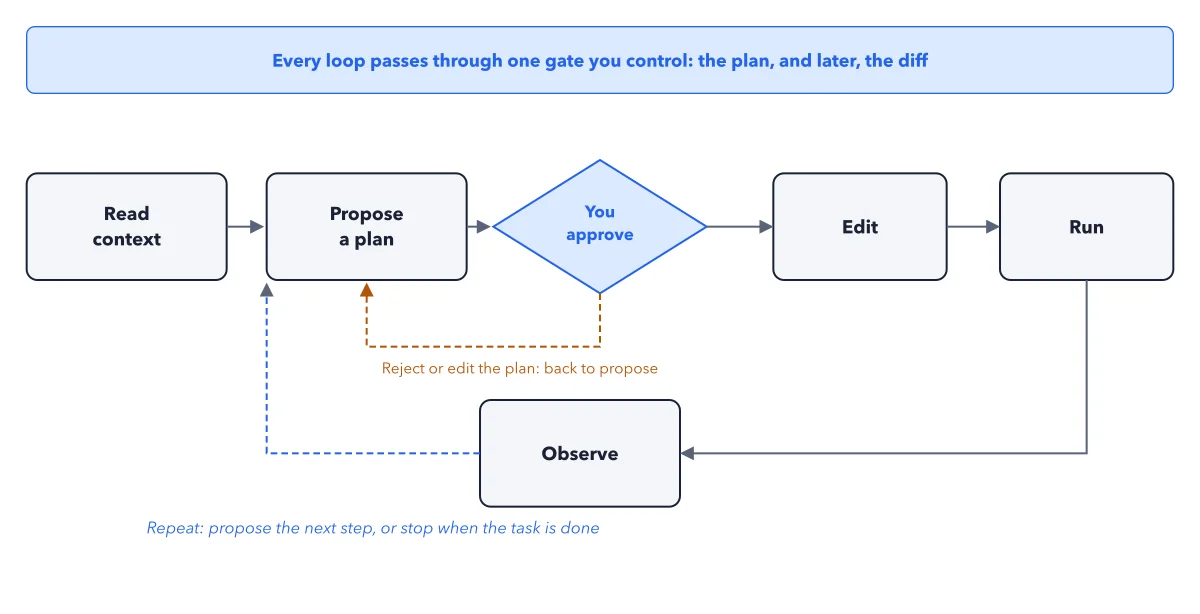
The agent loop
2026-09-17
Gemini
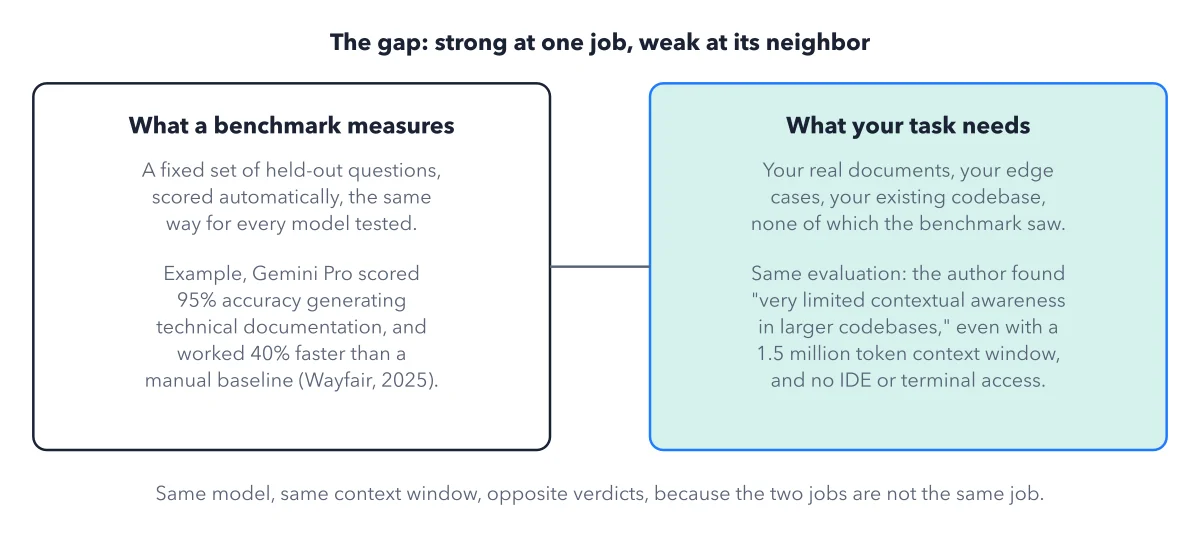
What a benchmark measures versus what you need
2026-09-17
Vercel
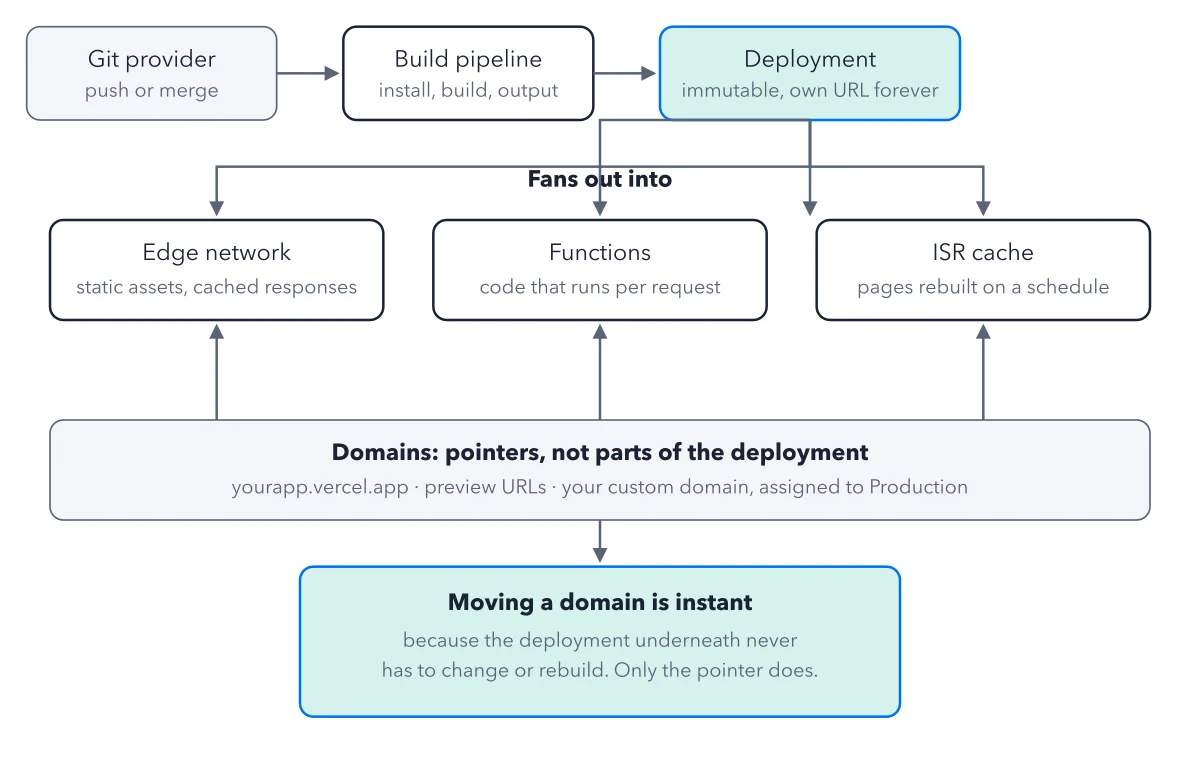
The big schema
2026-09-17
OpenAI Codex
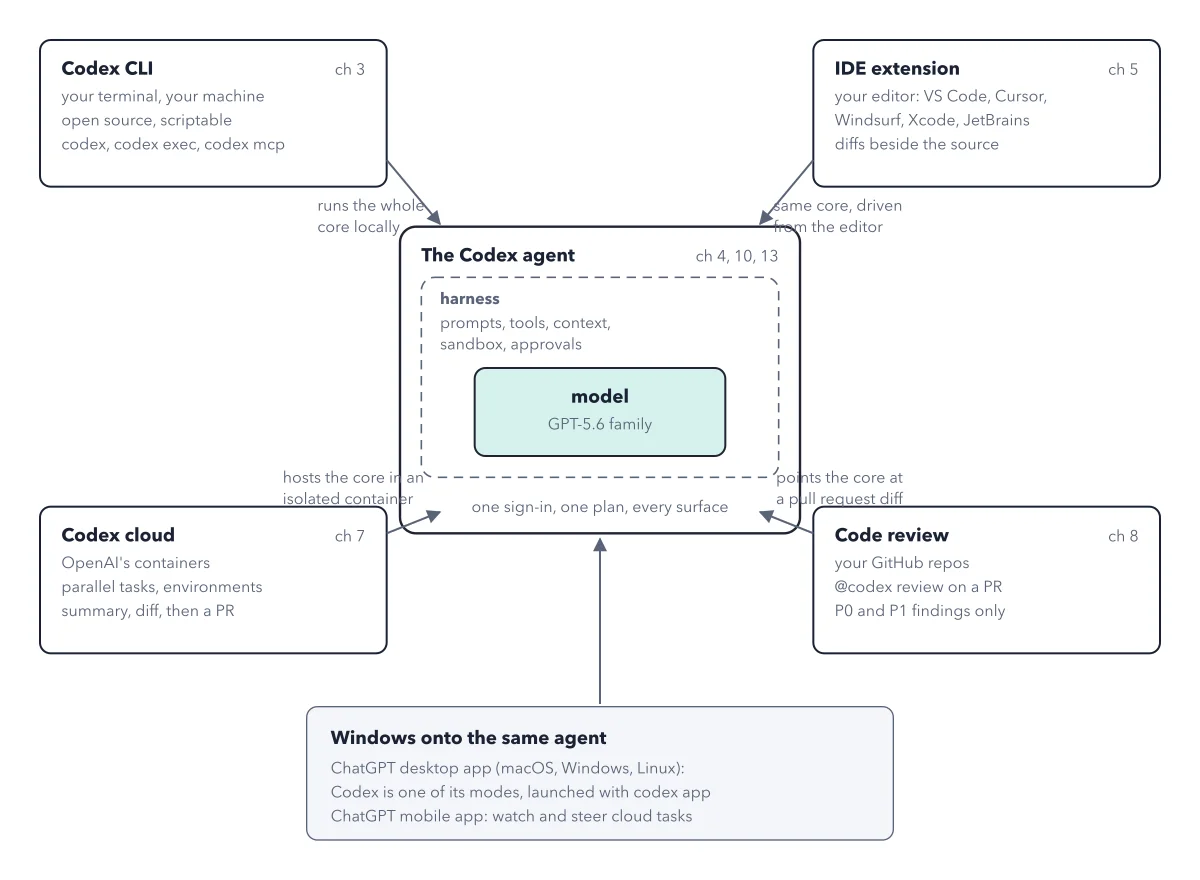
The big schema
2026-09-16
Make.com
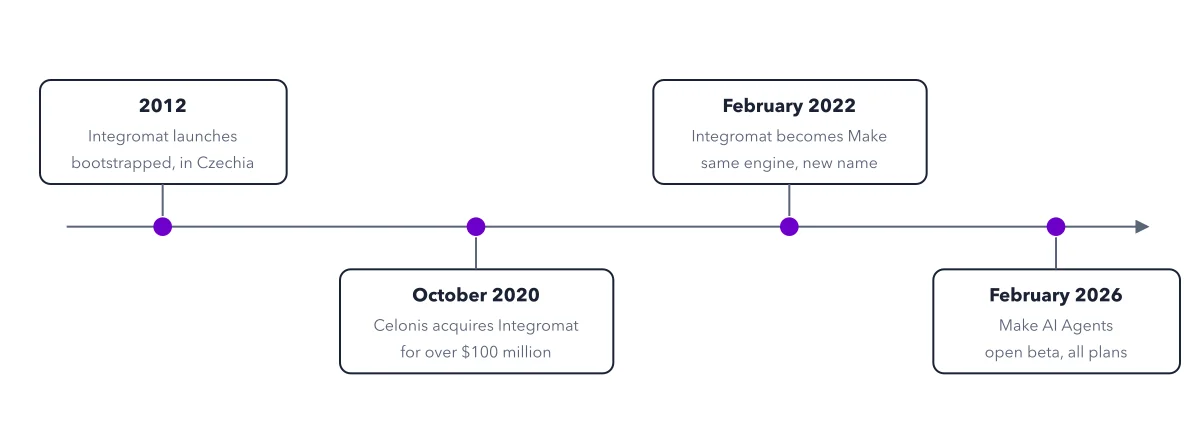
From Integromat to Make
2026-09-16
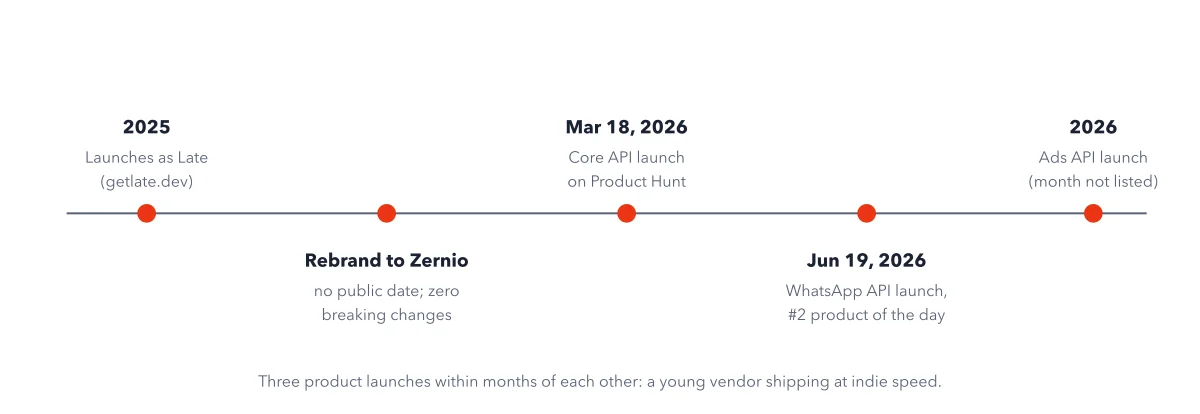
Zernio
The short history
2026-09-16
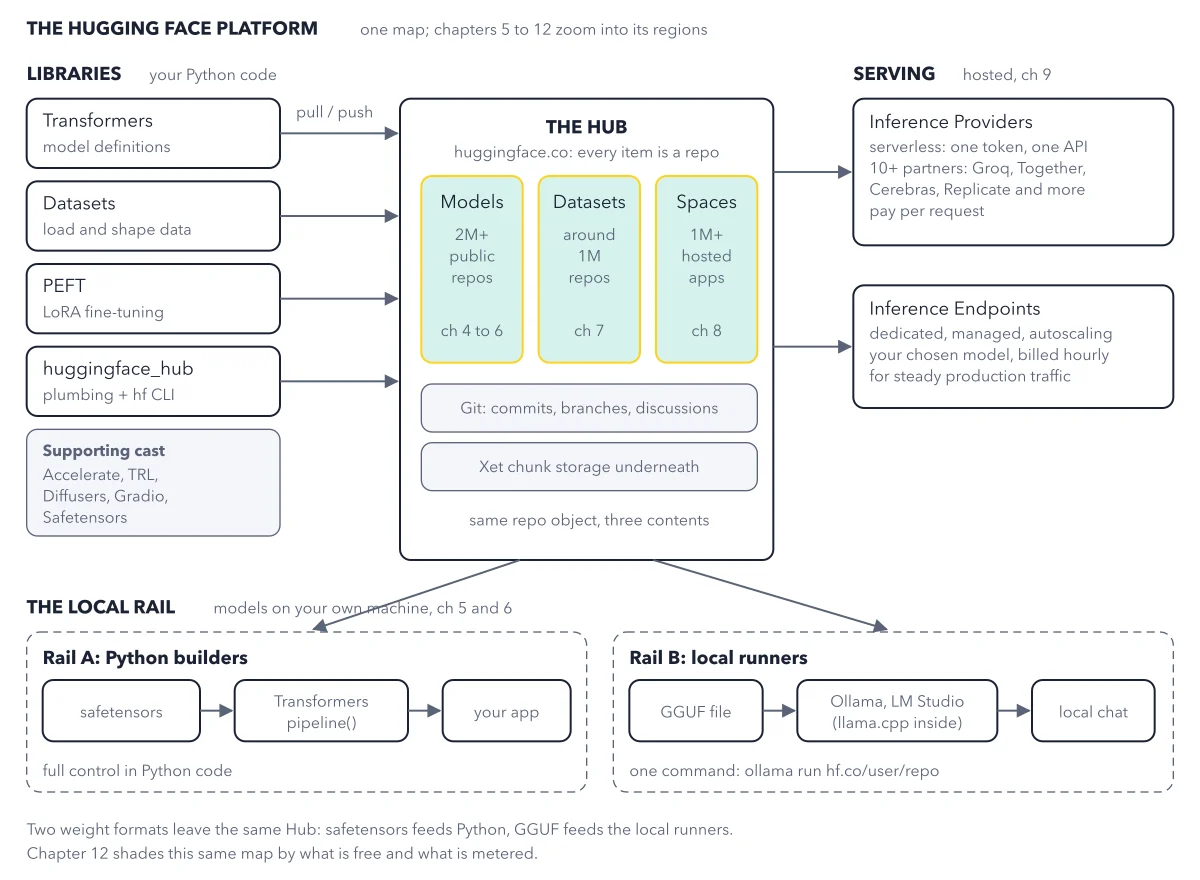
Hugging Face
The master schema of Hugging Face
2026-09-15
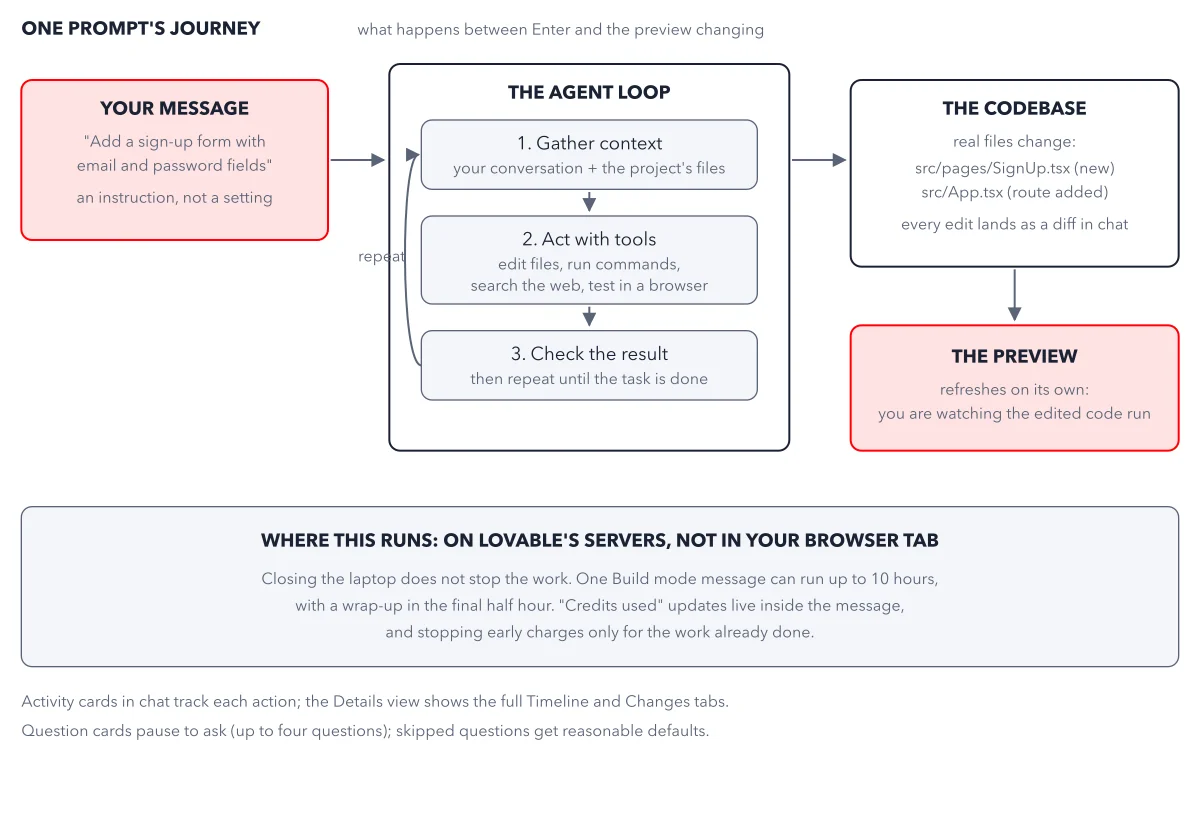
Lovable
One prompt's journey
2026-09-15
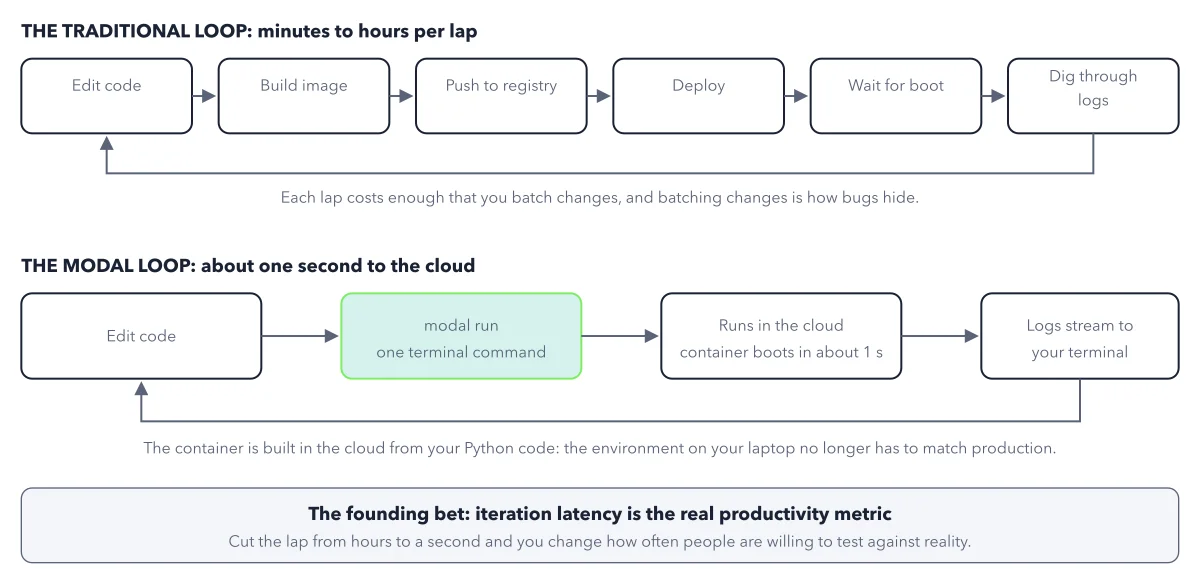
Modal
Two feedback loops
2026-09-15
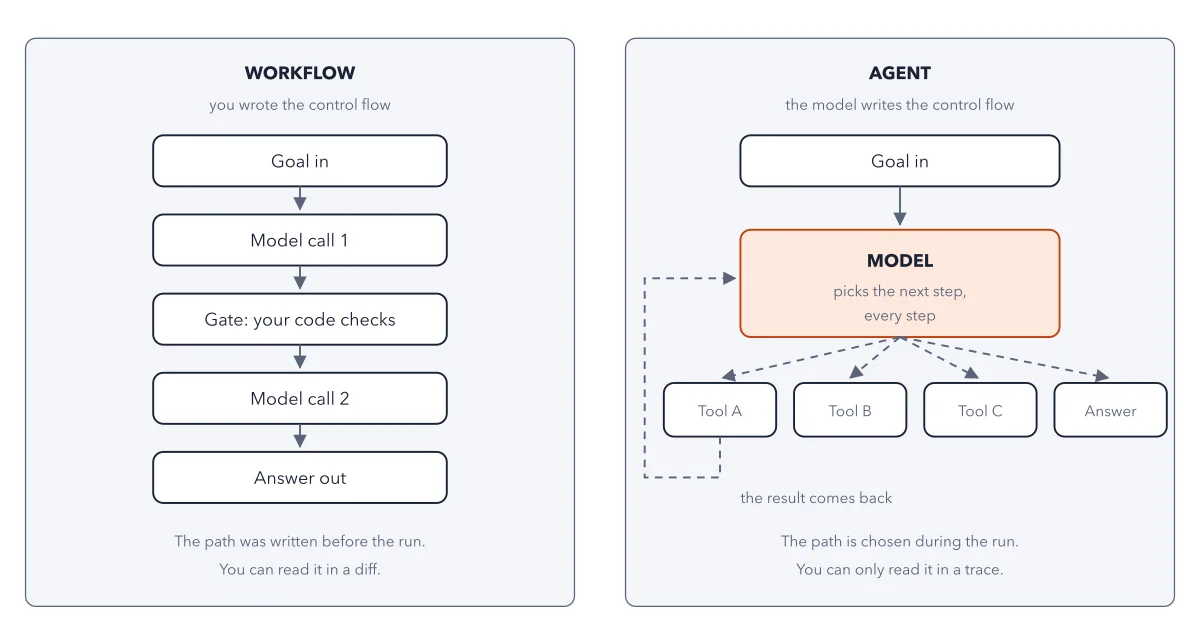
AI Agents
The same job, two architectures
2026-09-14
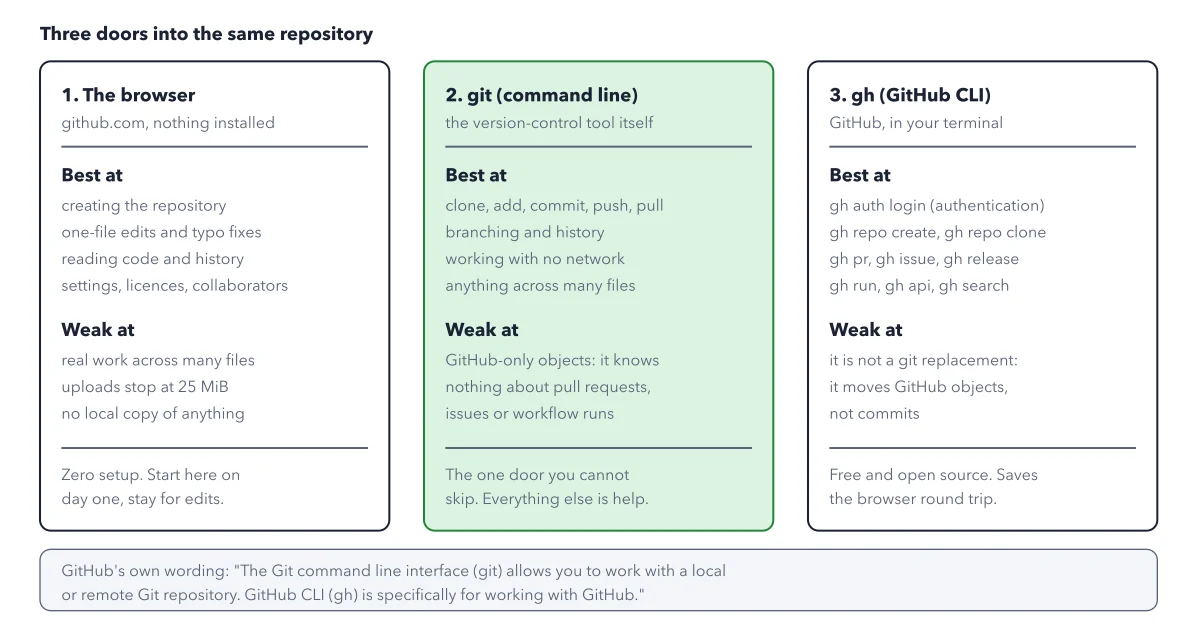
GitHub
Three doors, one repository
2026-09-14
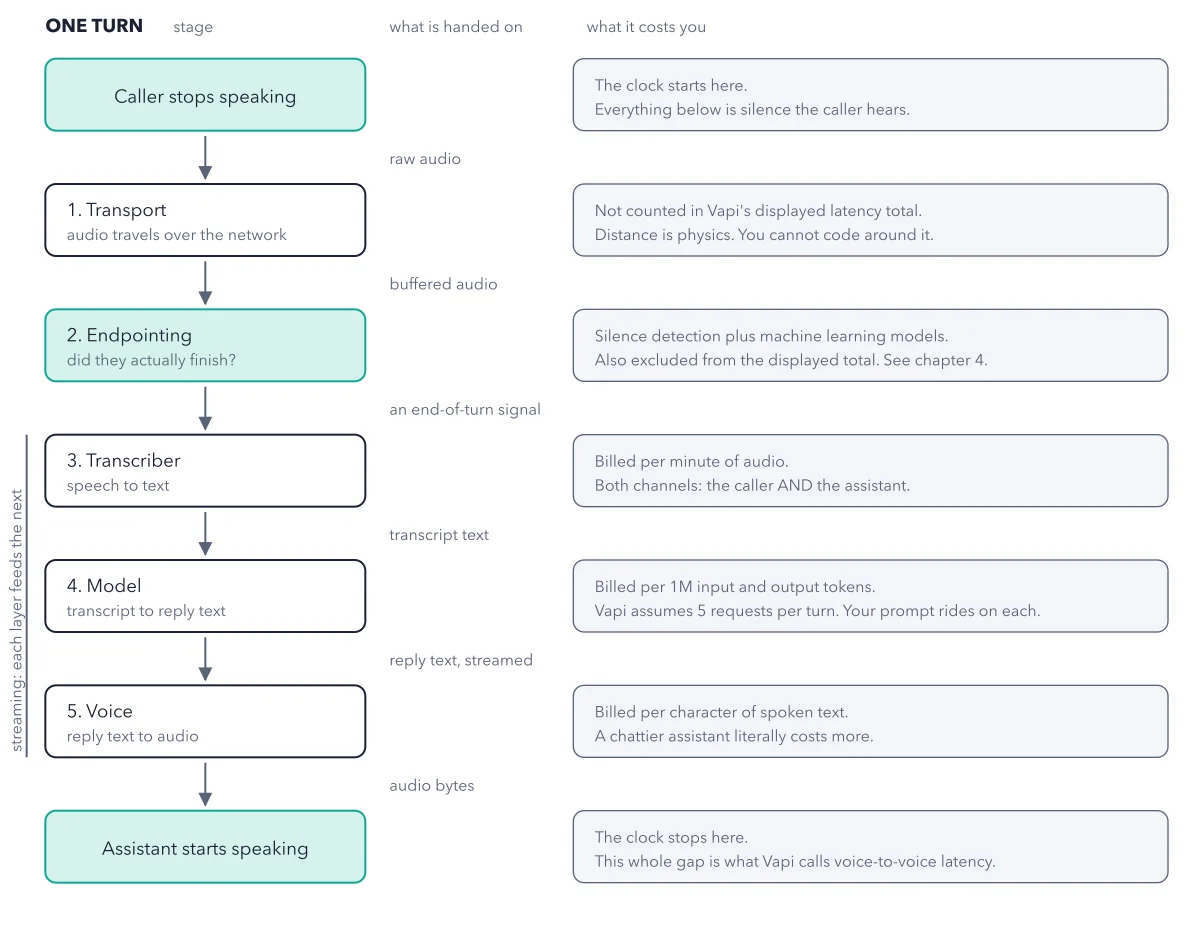
Vapi
Anatomy of one turn
2026-09-14
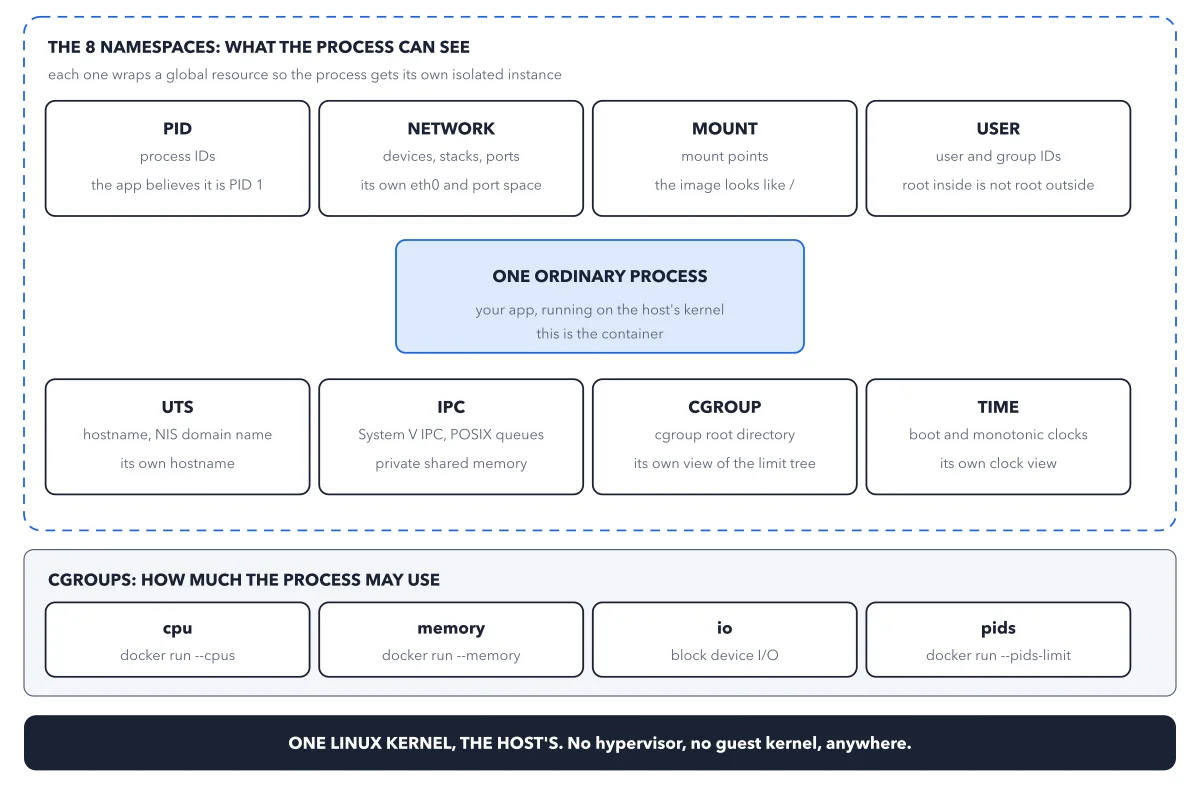
Docker
A container, opened up
2026-09-13
n8n
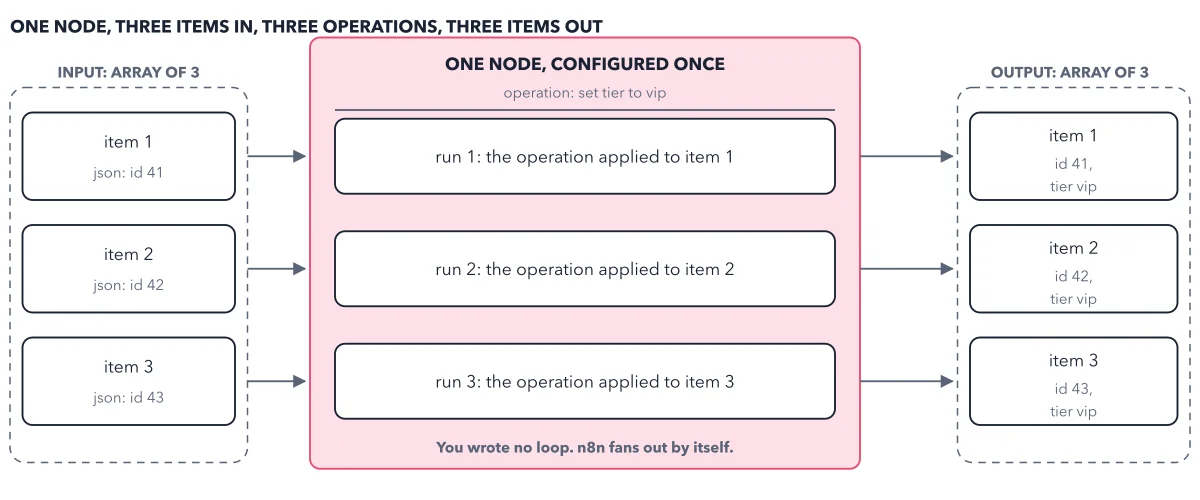
One node, three items in, three items out
2026-09-13
Tech Hiring
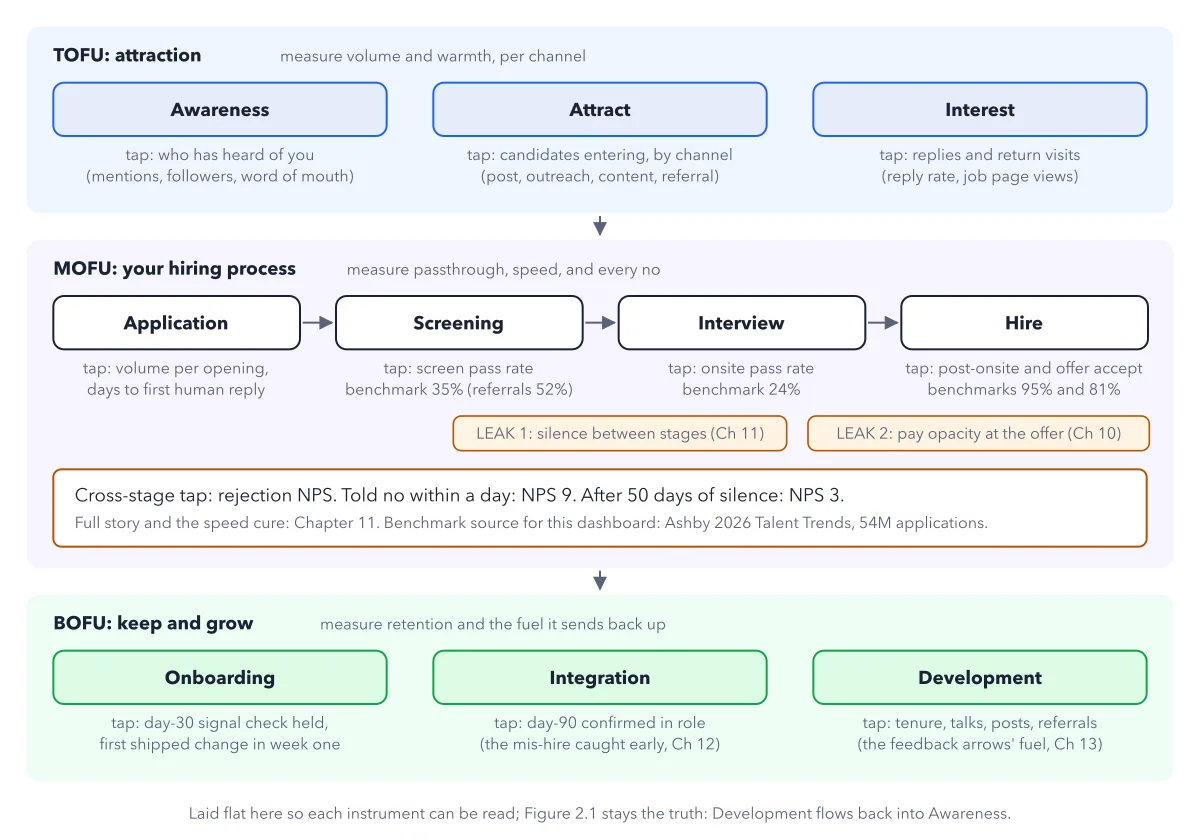
The funnel debug dashboard: one metric tap per stage
2026-09-13
ElevenLabs
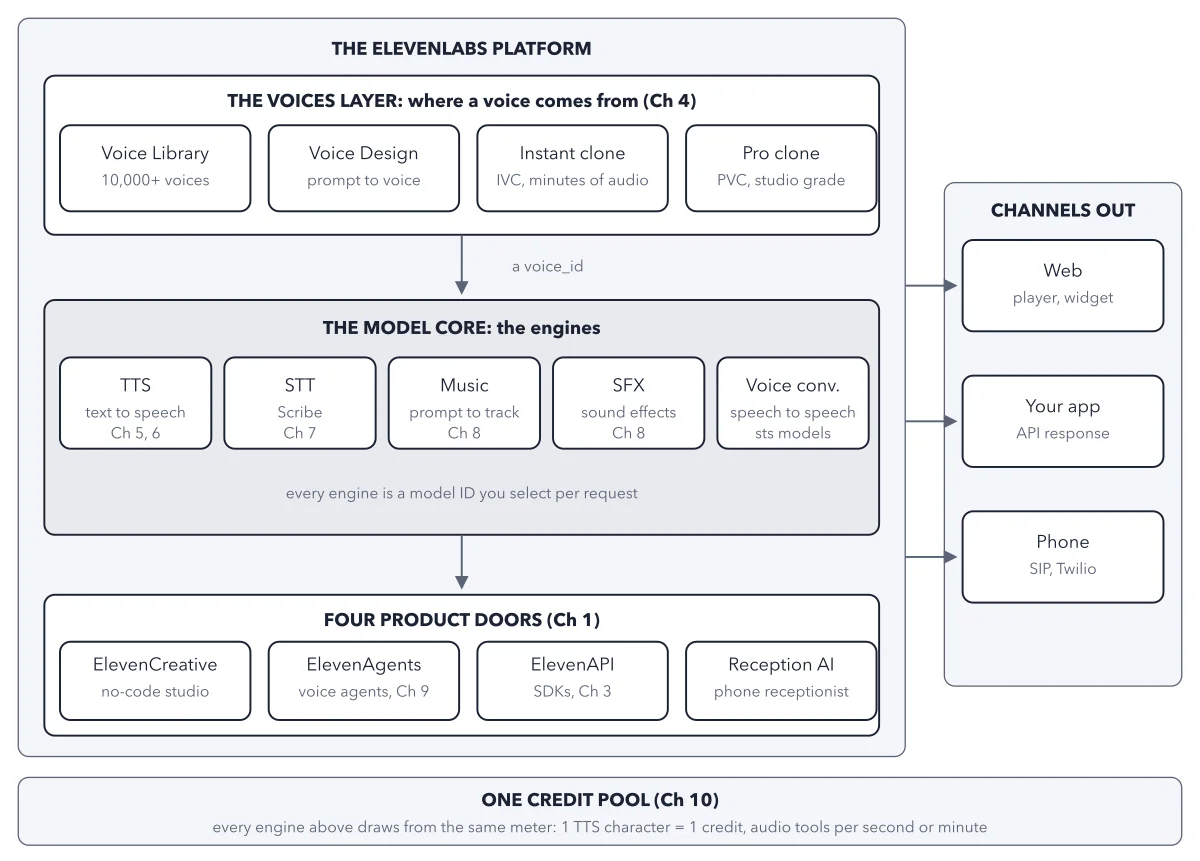
The big schema, this book's anchor map
2026-09-12
Kimi Code
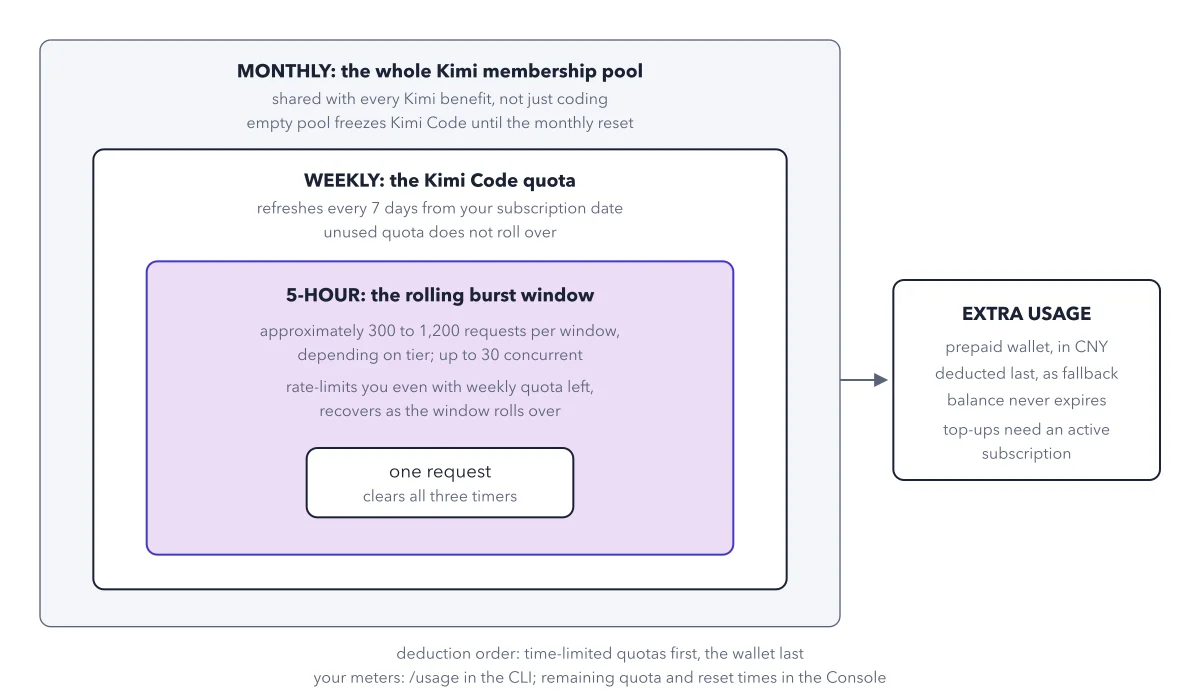
The three quota timers, nested
2026-09-12
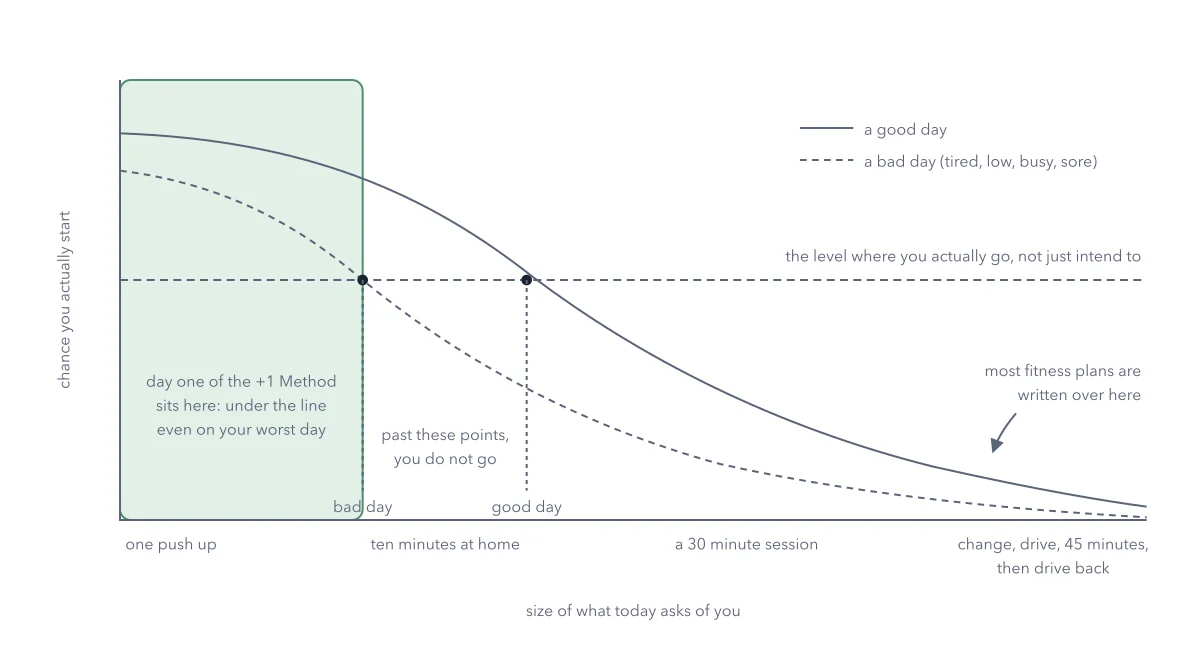
The +1 Method
The resistance threshold
2026-09-12
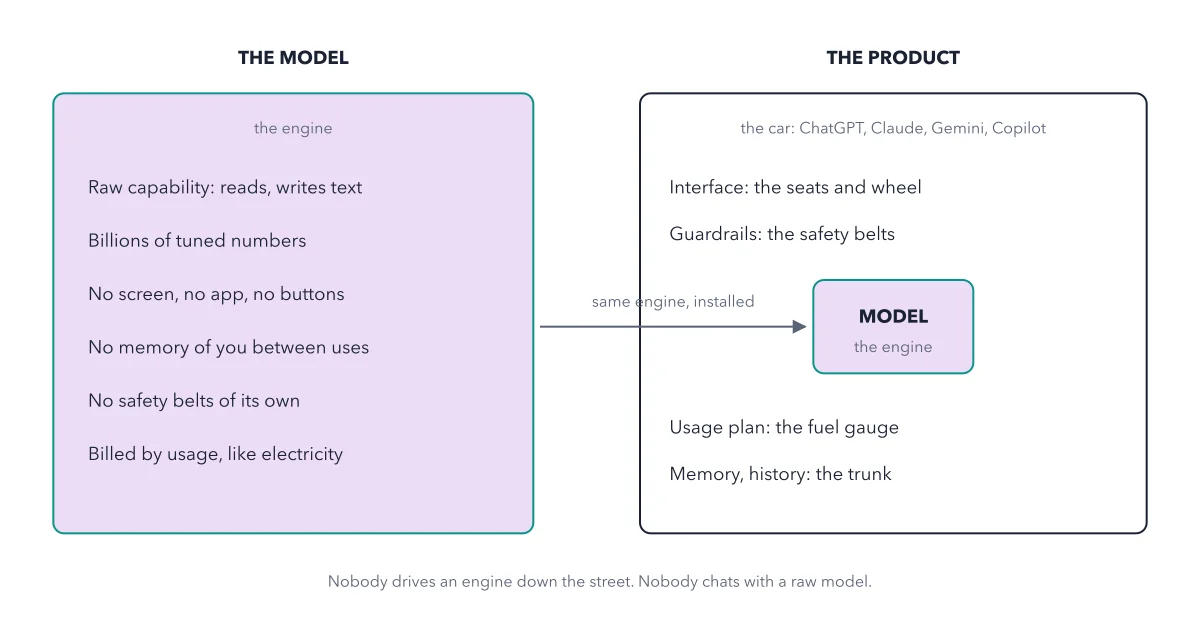
AI
The model is raw text-generating capability
2026-09-11
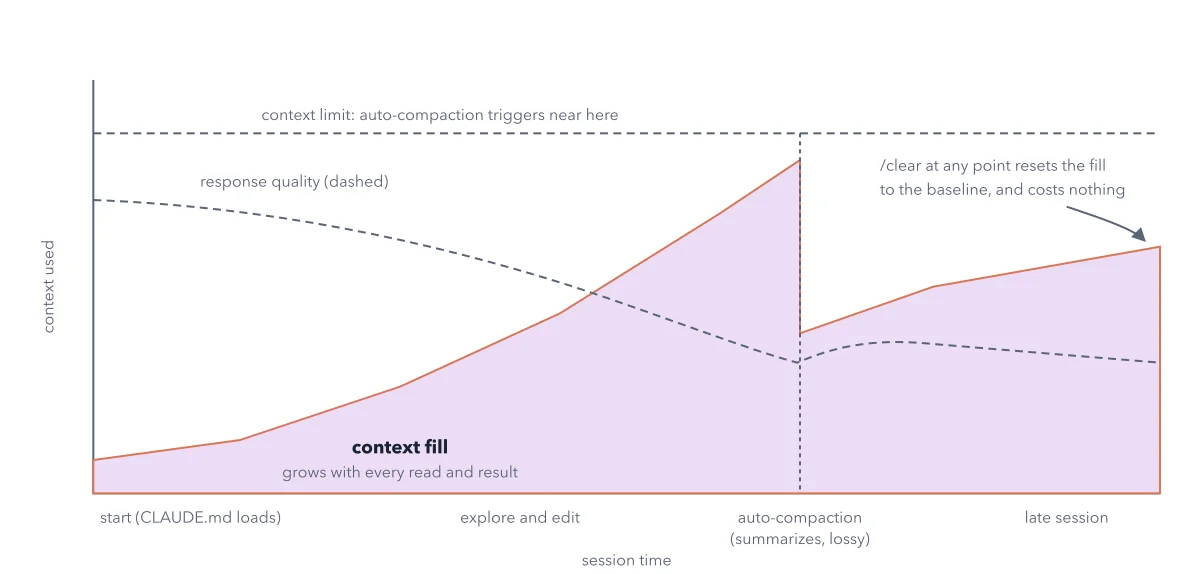
Claude Code
The context gauge across one session
2026-09-11
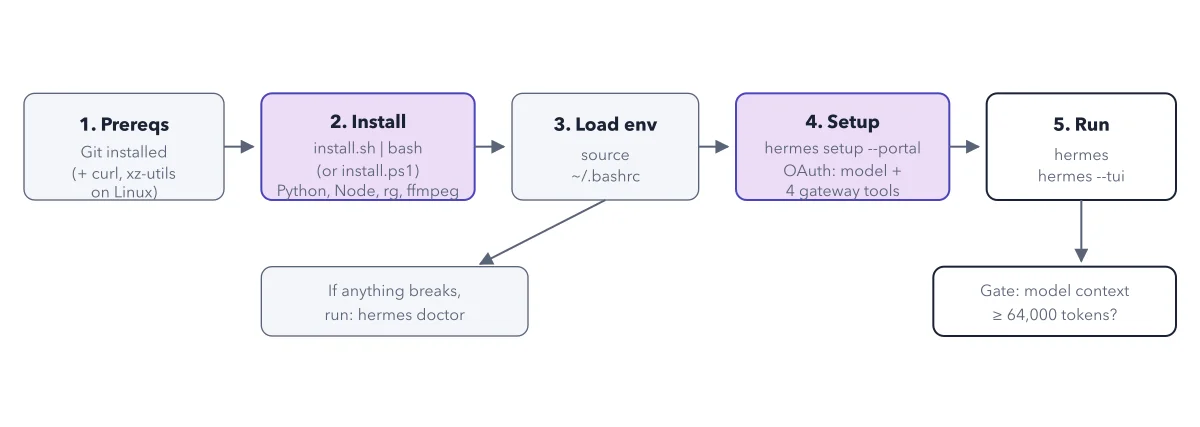
Hermes Agent
Install to first session, left to right
2026-09-11
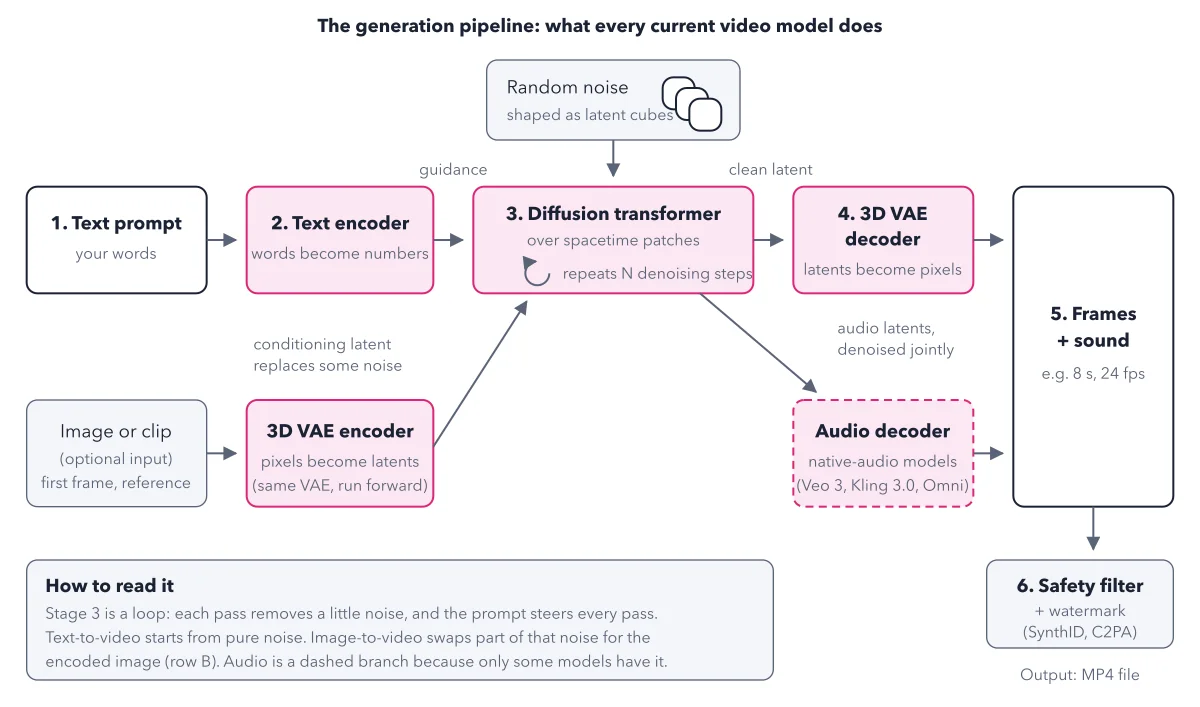
AI Video
The generation pipeline, the anchor schema for this book
2026-09-10
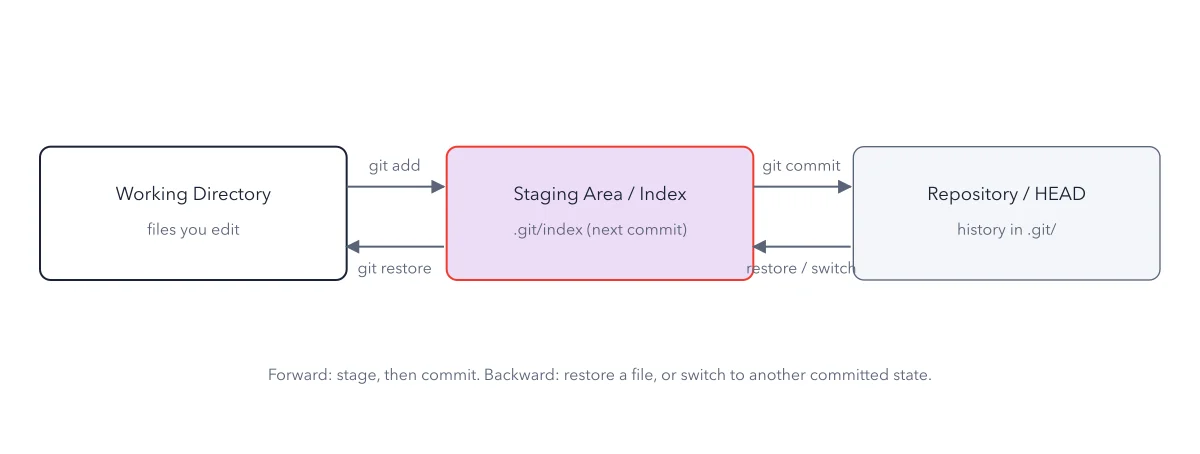
Git
The three trees: work moves forward with add and commit, and back with restore and switch
2026-09-10
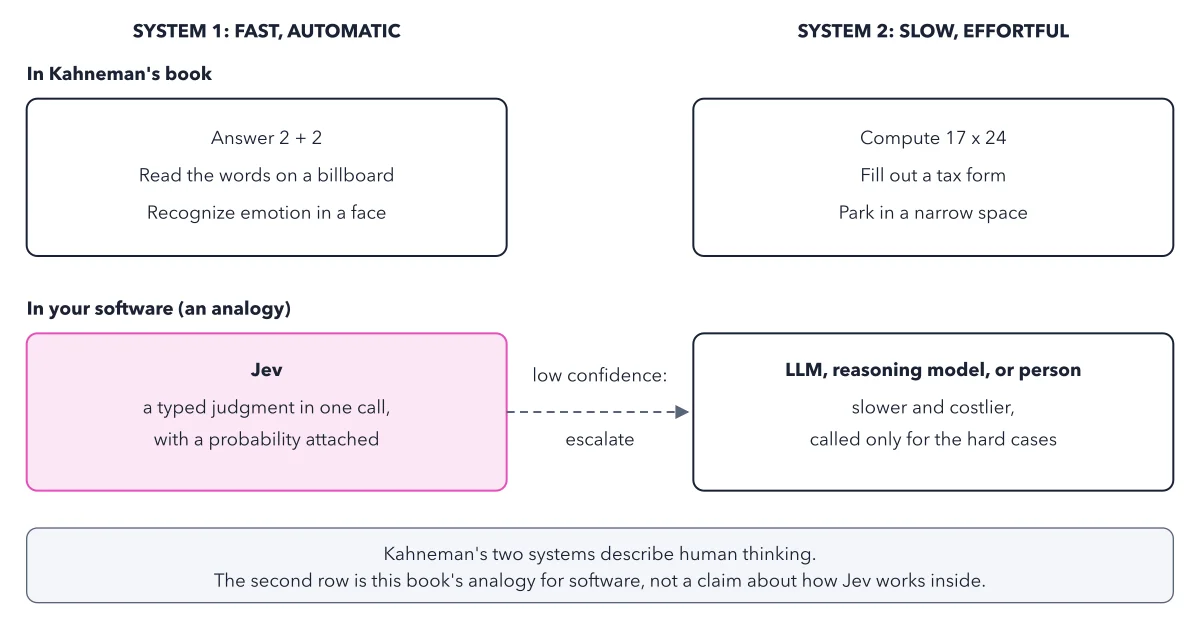
Jev
System 1 and System 2, with Kahneman's own examples in the top row and the software...
2026-09-10
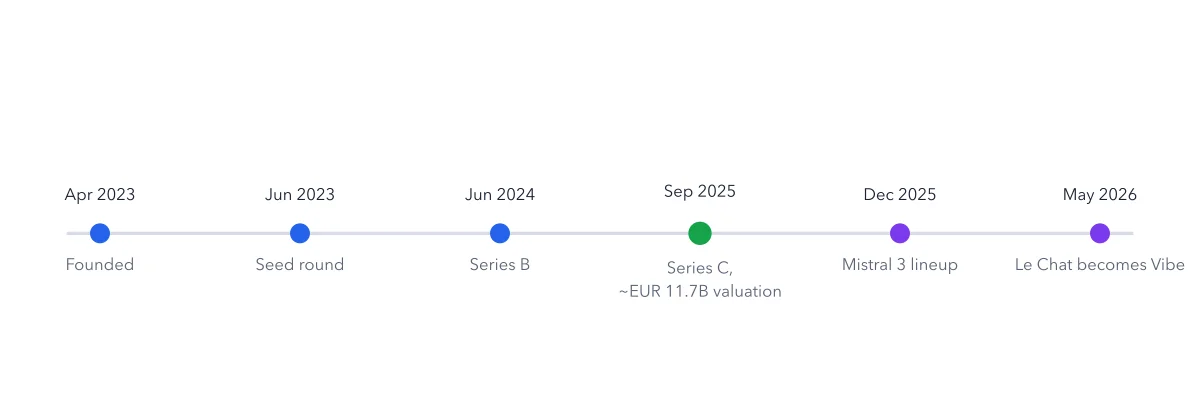
Mistral
A short timeline of the company itself, founding to the Series C, with the...
2026-09-09
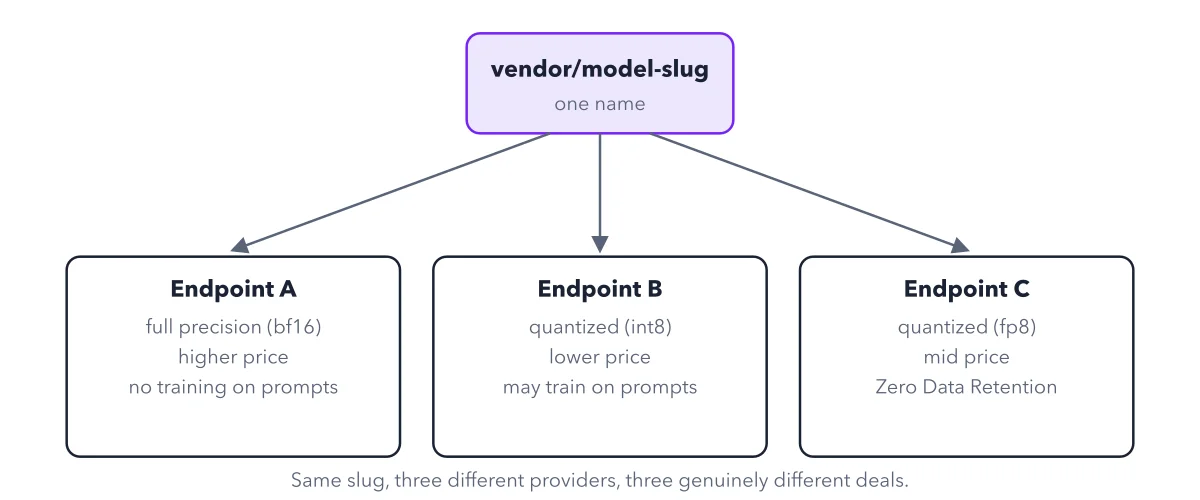
OpenRouter
One model slug, many provider endpoints
2026-09-09
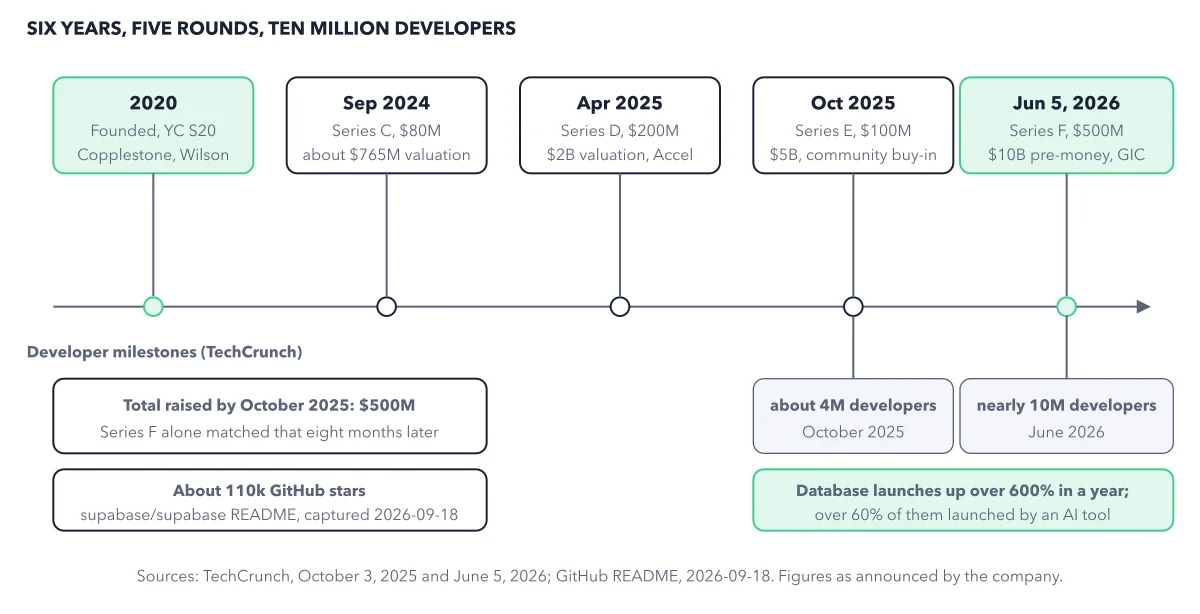
Supabase
The Supabase timeline from founding to the June 2026 Series F, with the...
2026-09-09
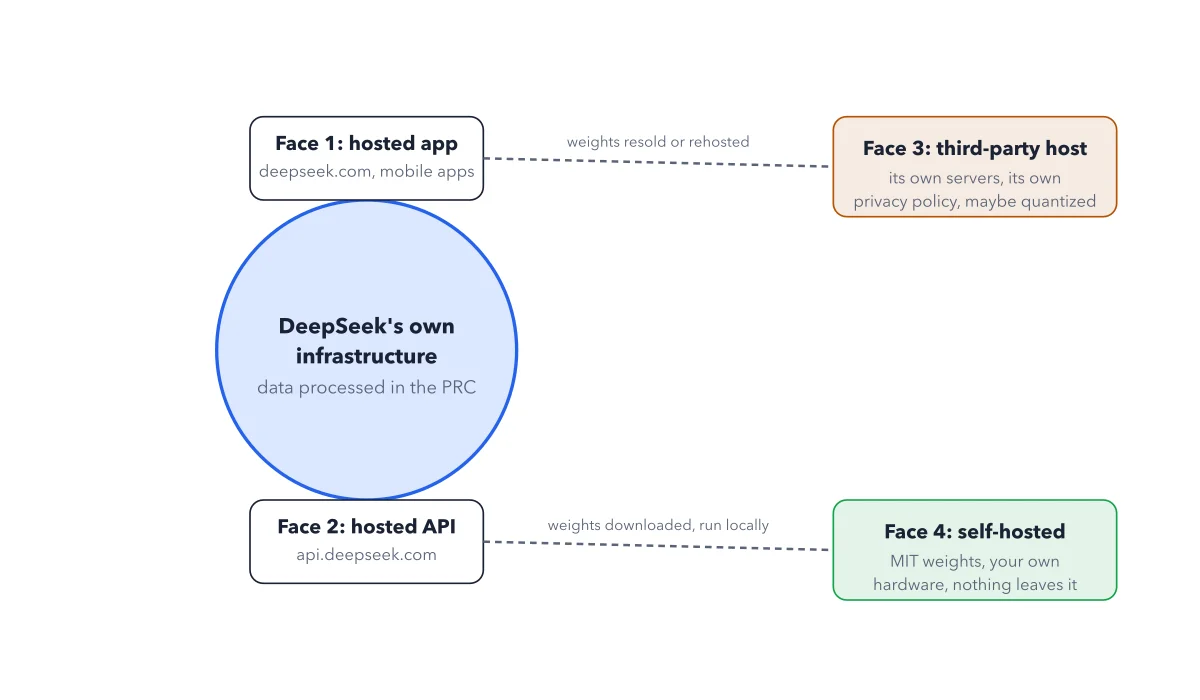
DeepSeek
The four faces
2026-09-08
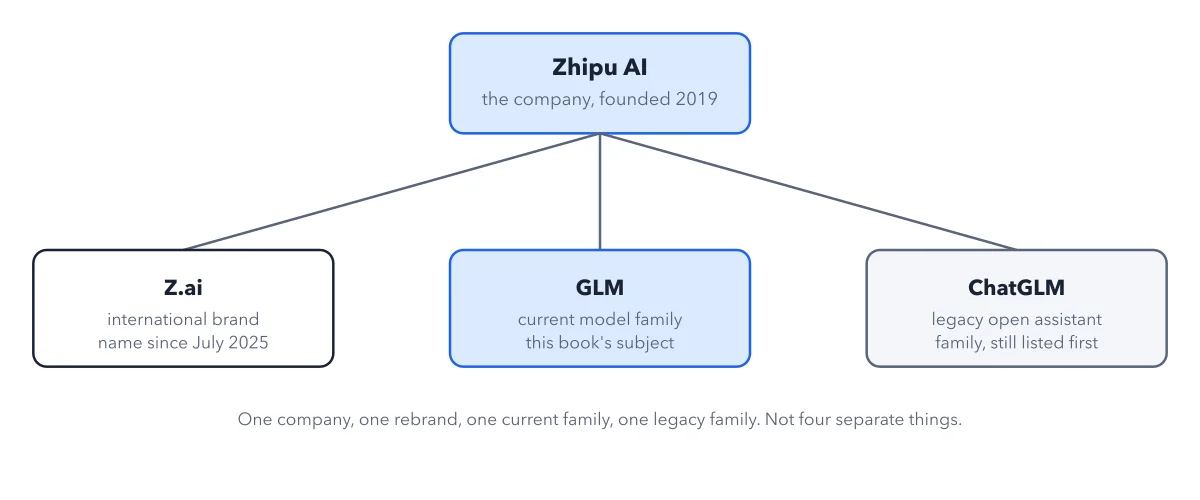
GLM
2026-09-08
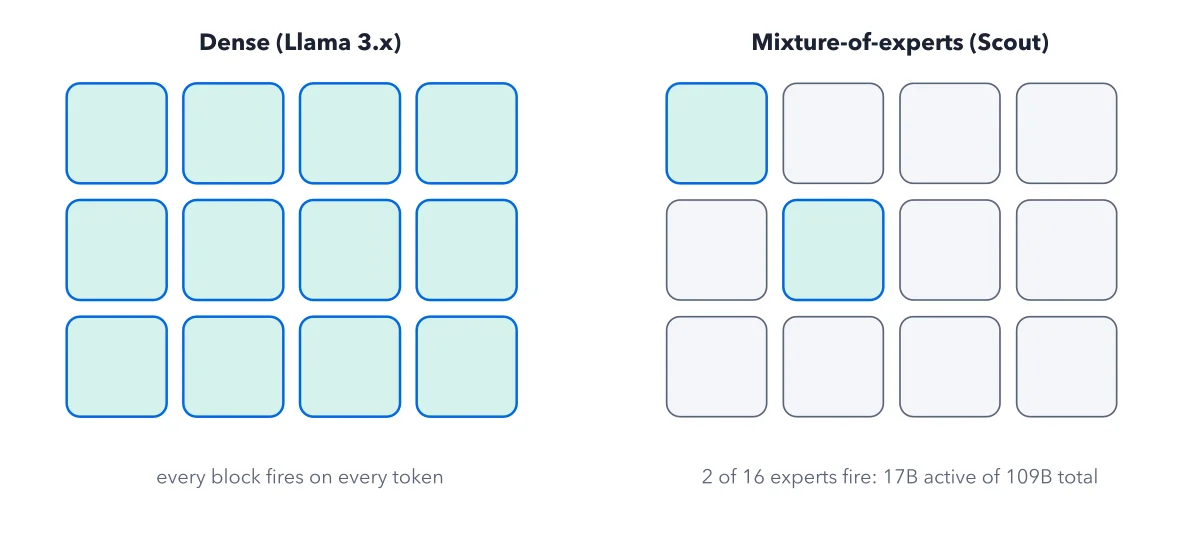
Llama
Dense versus mixture-of-experts, using Scout's own active-versus-total parameter split
2026-09-08
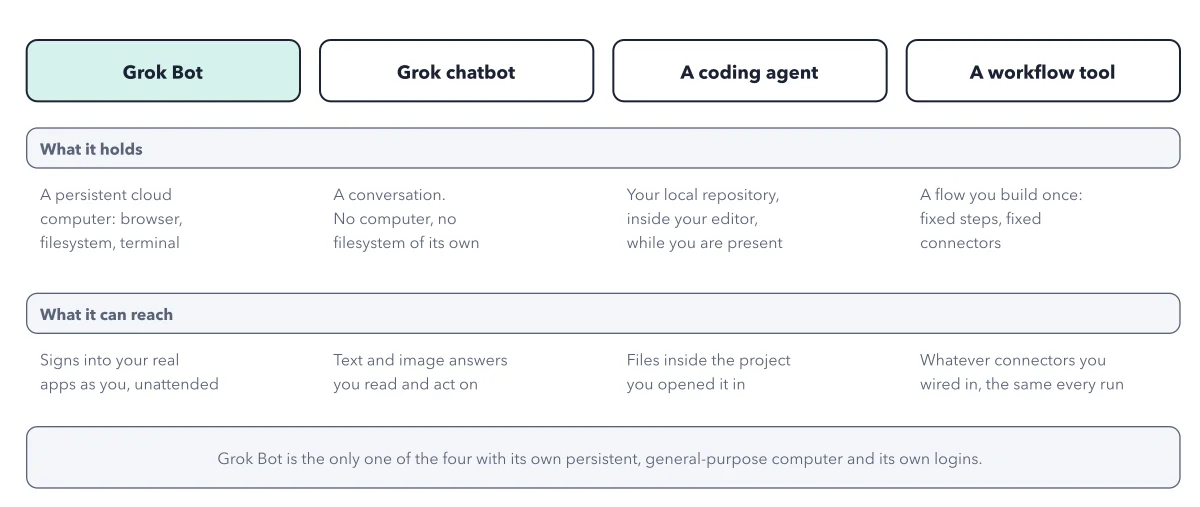
Grok Bot
What it is not
2026-09-07
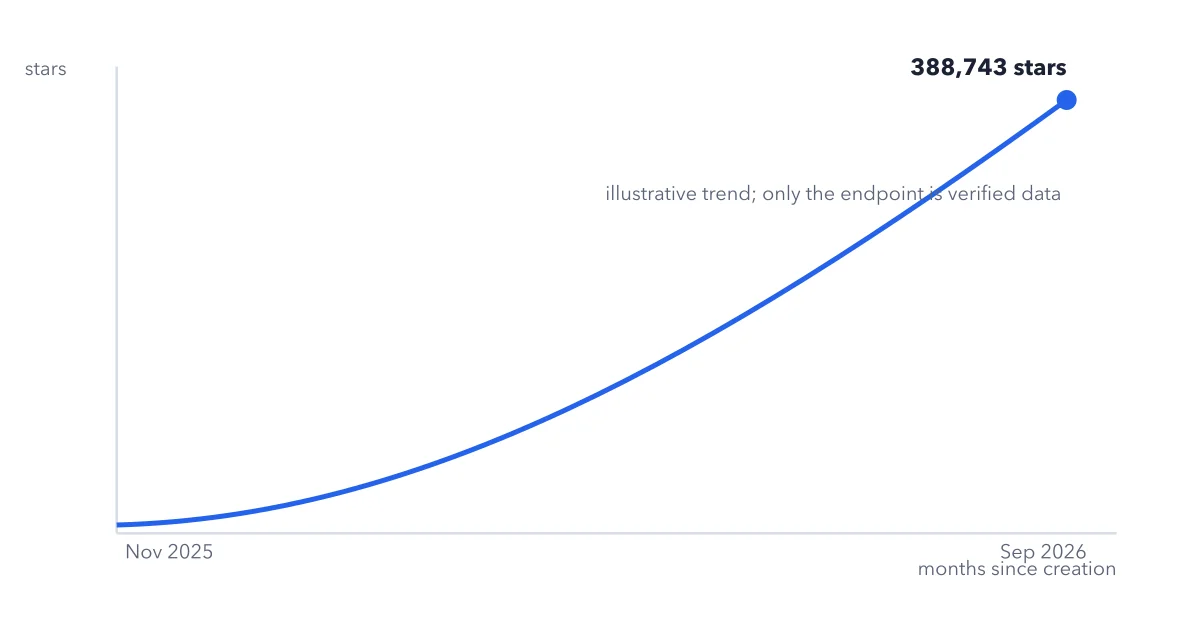
OpenClaw
Growth since creation
2026-09-07
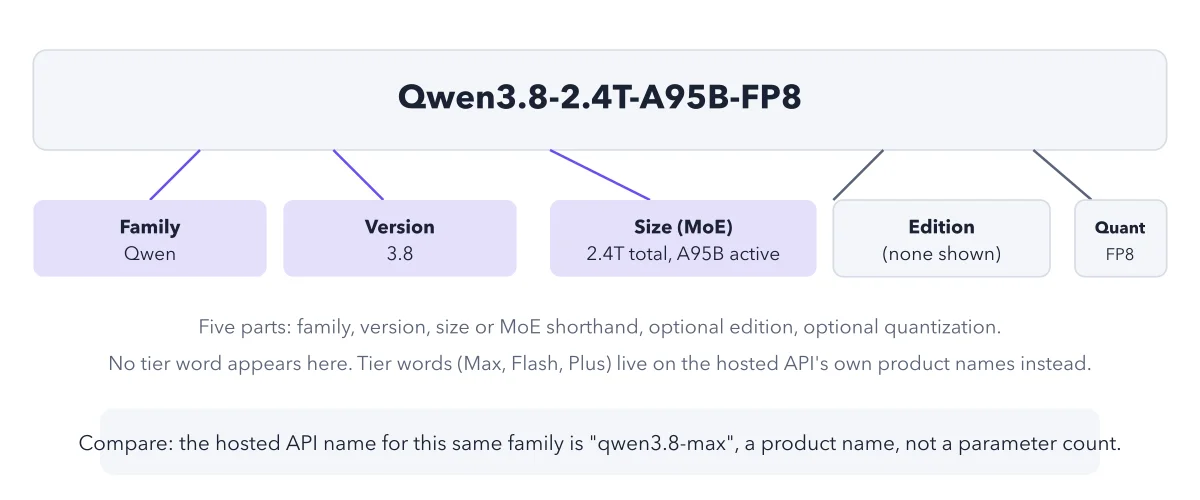
Qwen
The naming decoder, applied to a real Qwen open-weight checkpoint ID
2026-09-07
Fly.io
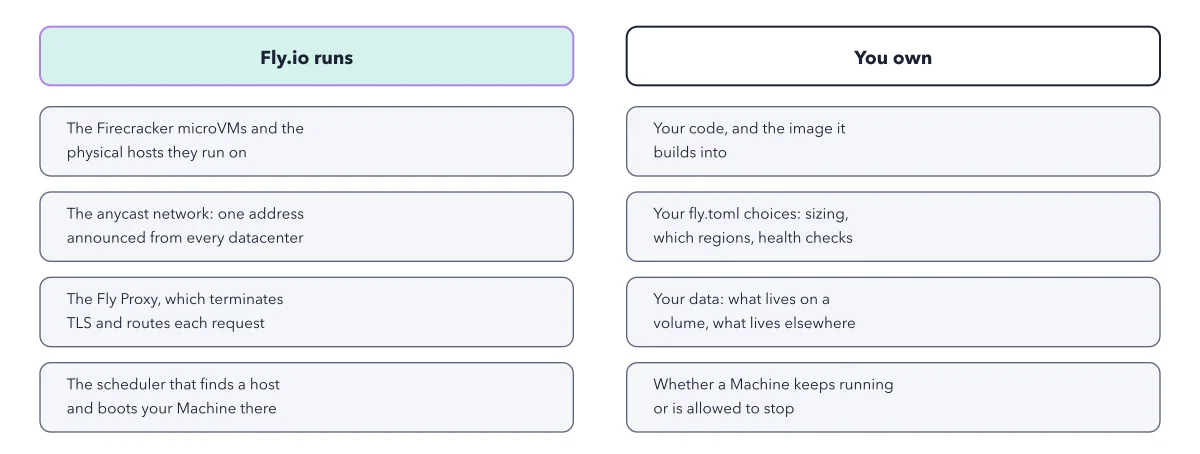
What Fly.io runs for you, and what stays yours to decide
2026-09-06
Gemini
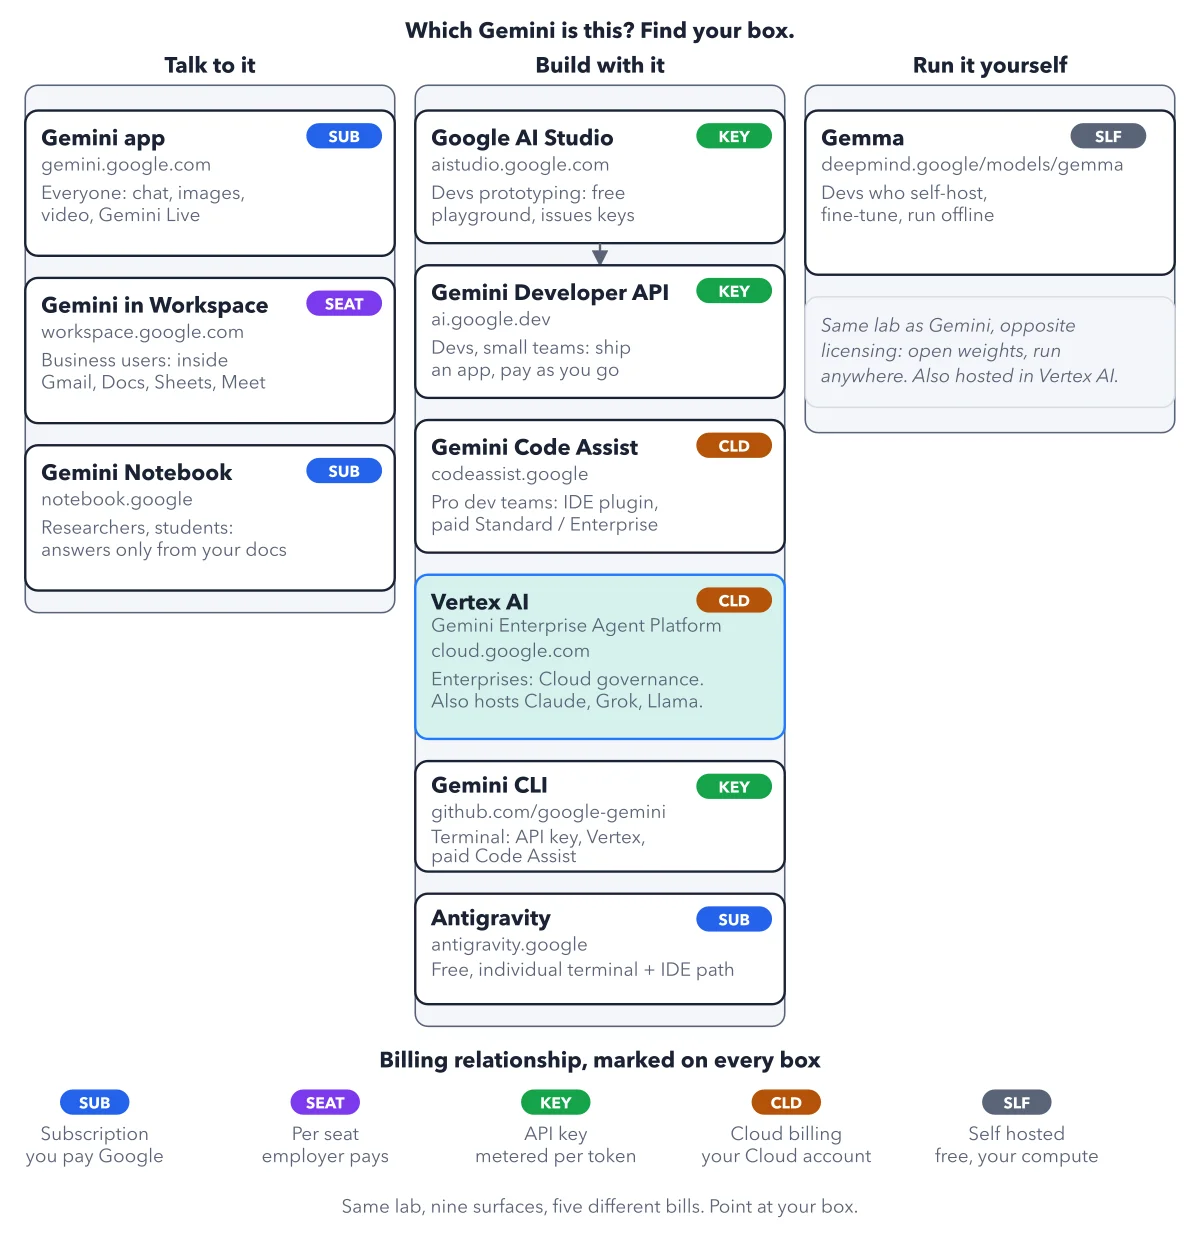
The Gemini family map
2026-09-06
Vercel
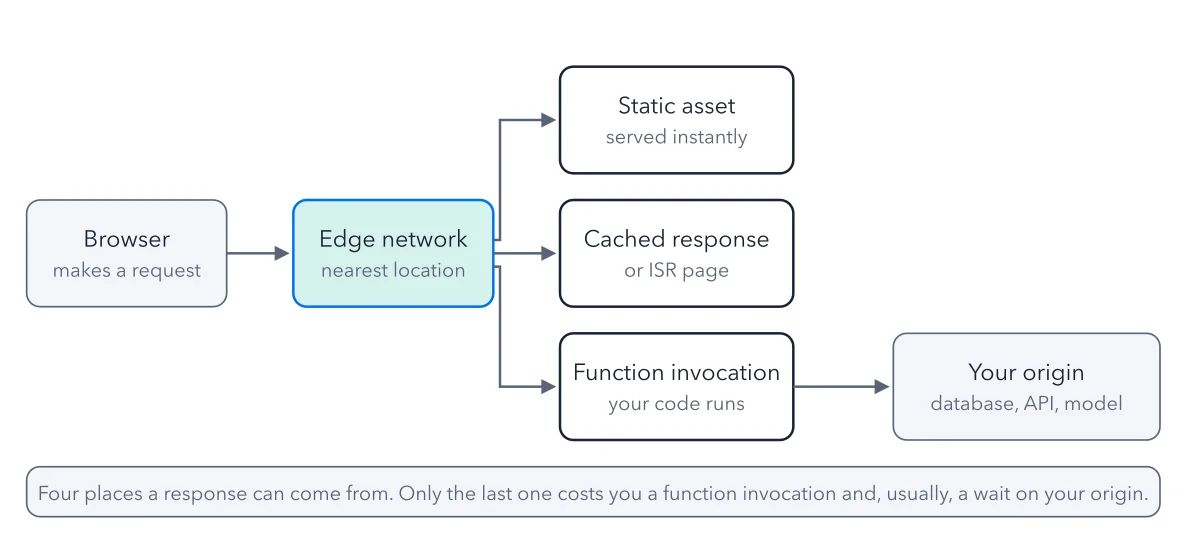
What happens to a request
2026-09-06
Cursor
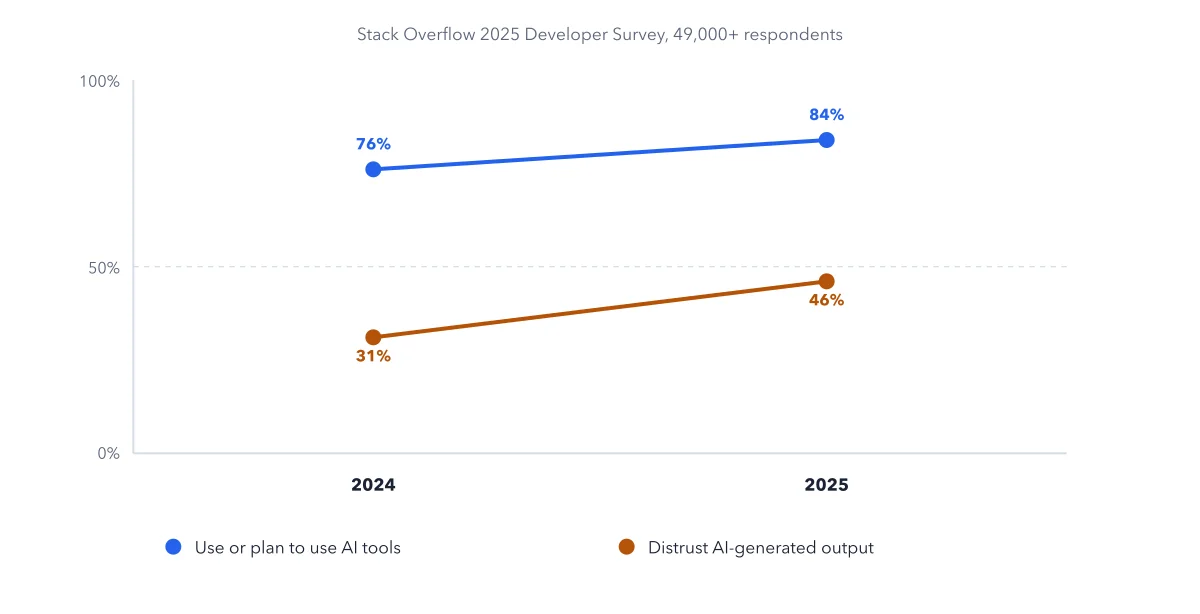
Adoption versus trust
2026-09-05
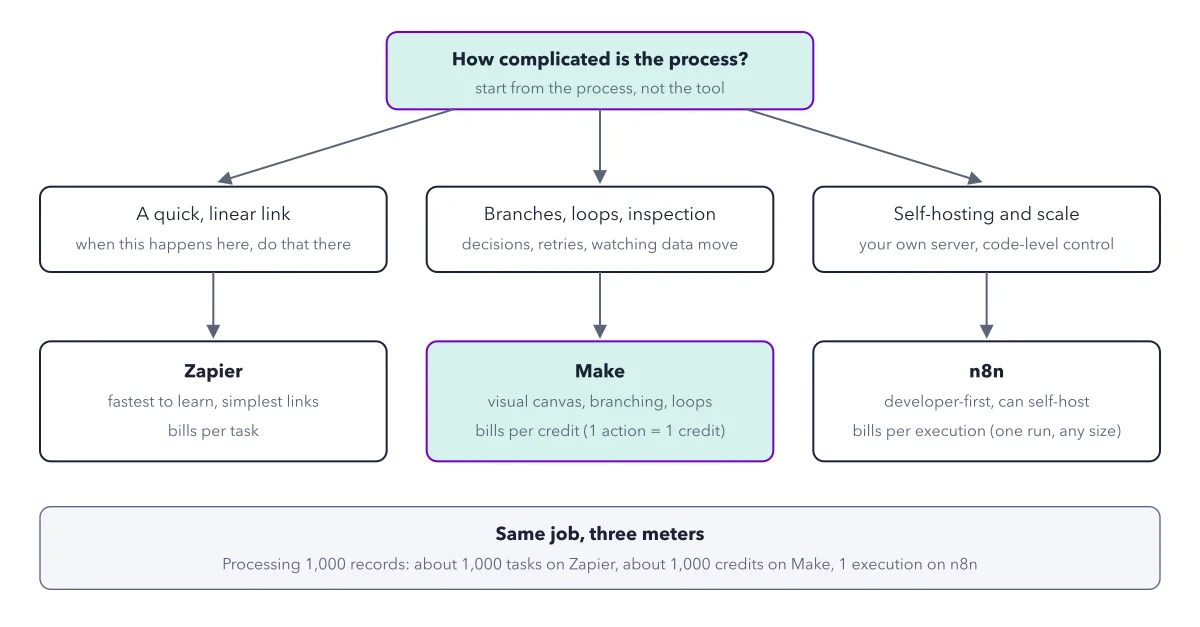
Make.com
The tool decision in one drawing
2026-09-05
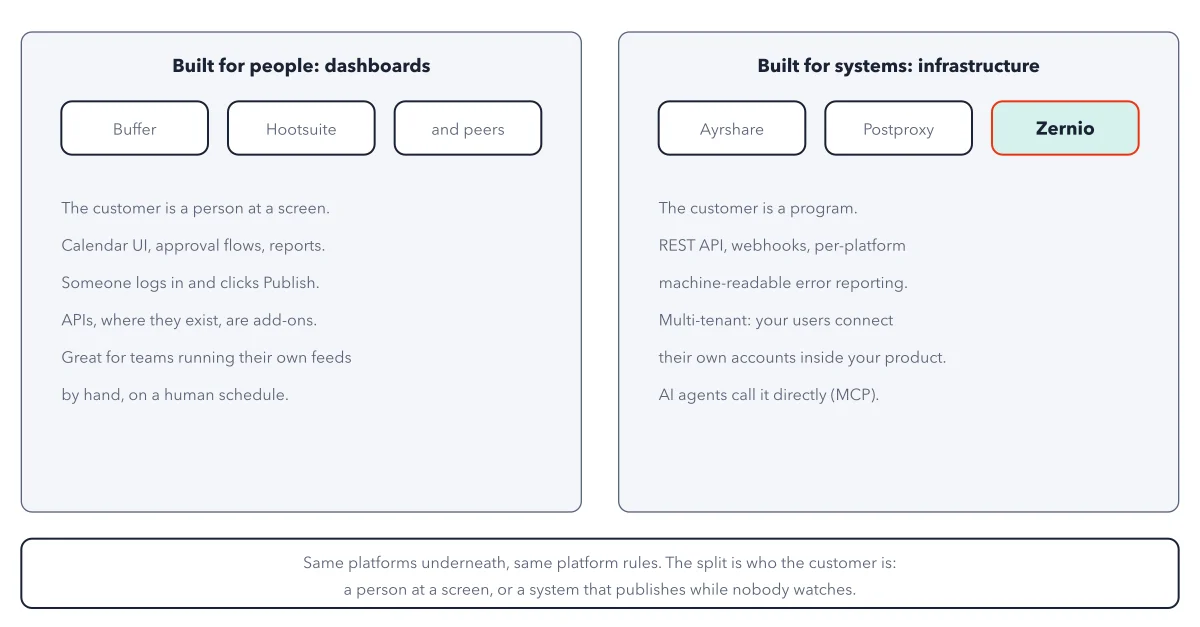
Zernio
The field map
2026-09-05
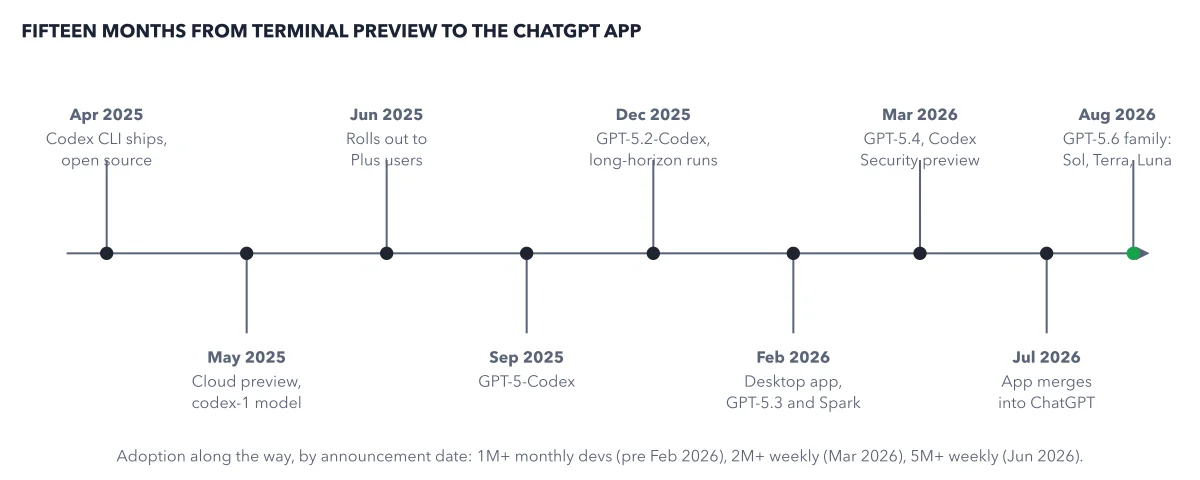
OpenAI Codex
The Codex timeline, April 2025 to August 2026, as reported by the cited history and...
2026-09-04
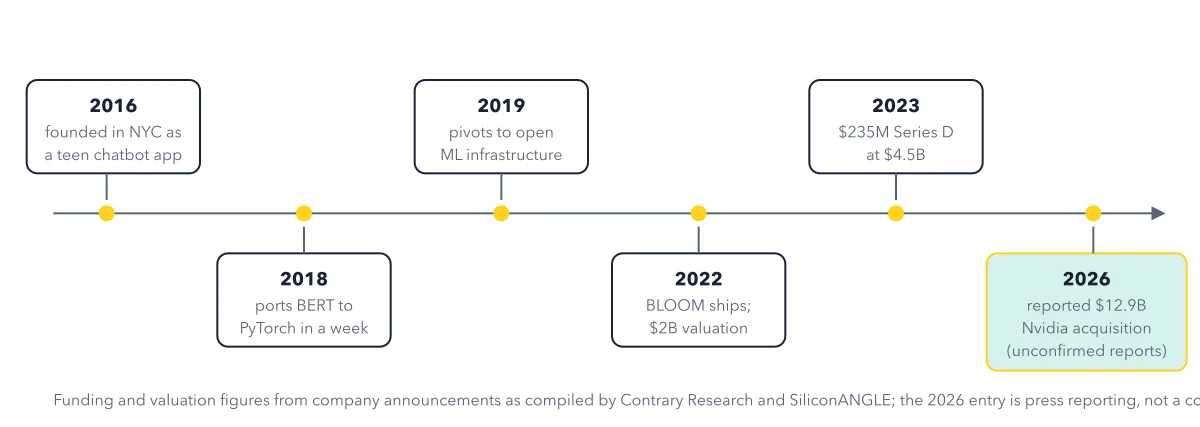
Hugging Face
Ten years in six stops
2026-09-04
Modal
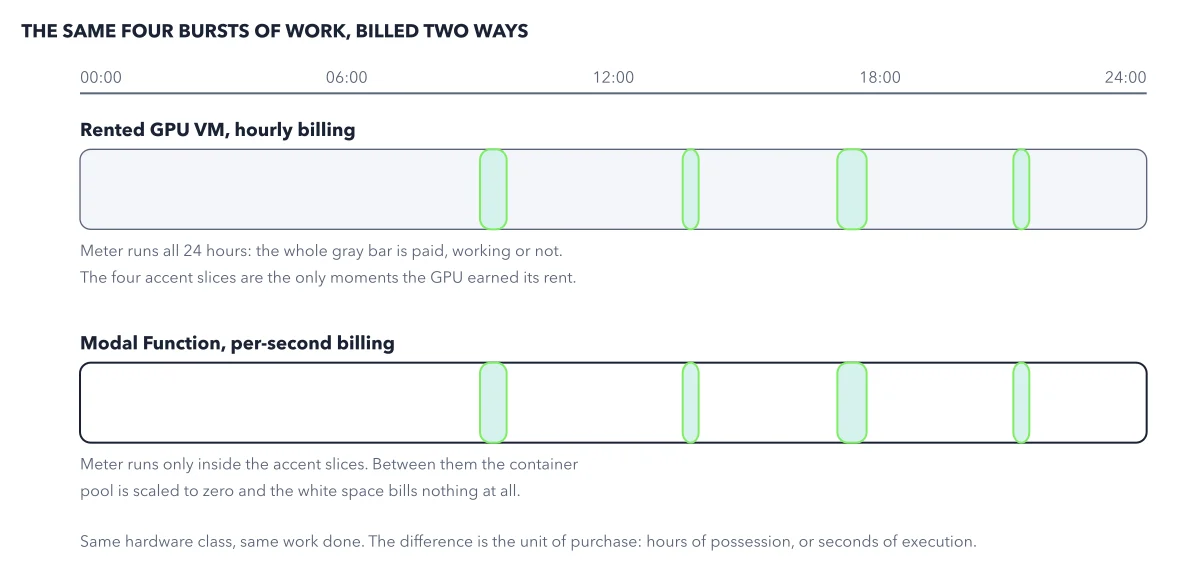
One day of bursty GPU work under the two billing models
2026-09-04
GitHub
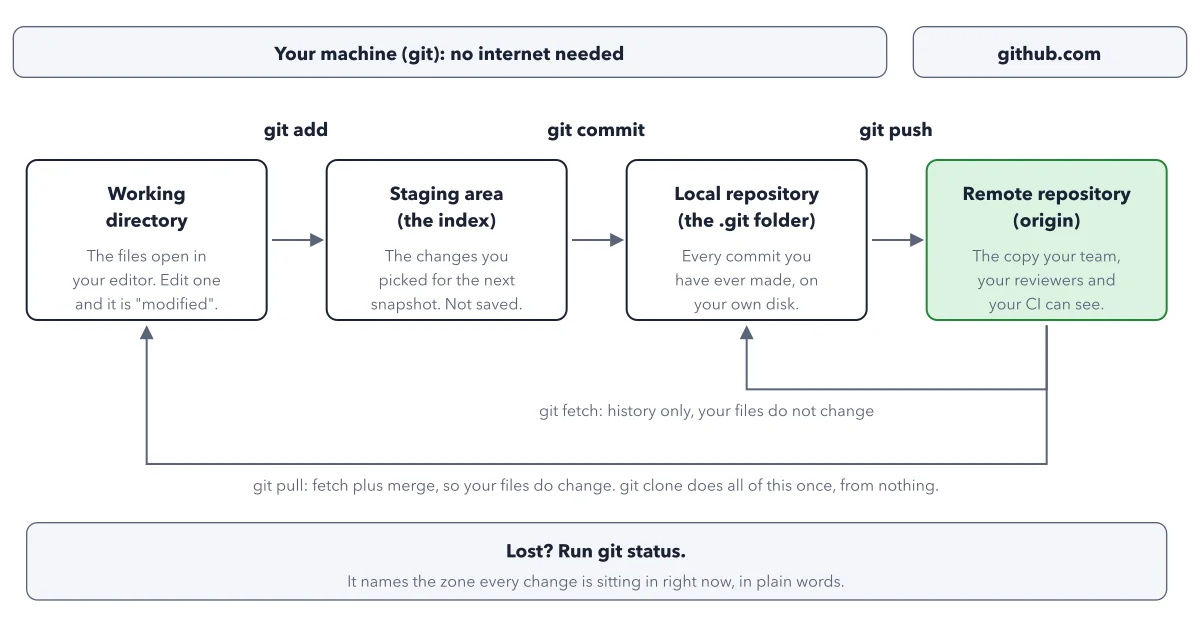
Where is my file right now
2026-09-03
Lovable
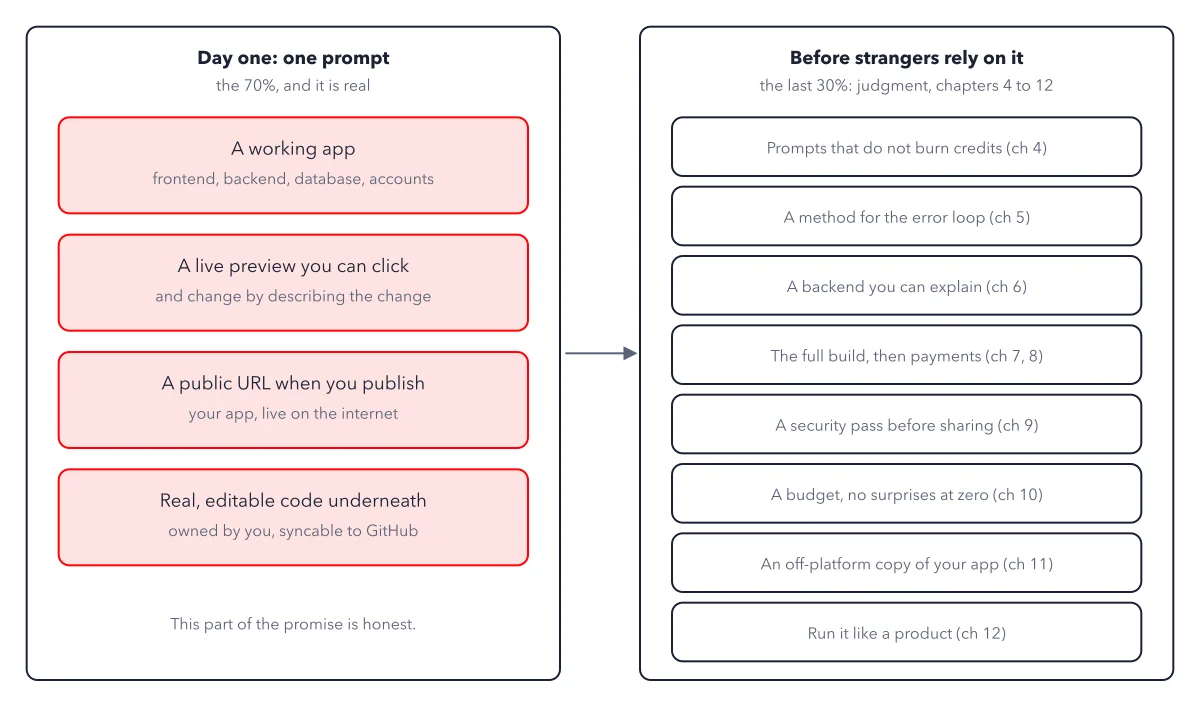
The promise and the practice
2026-09-03
Vapi
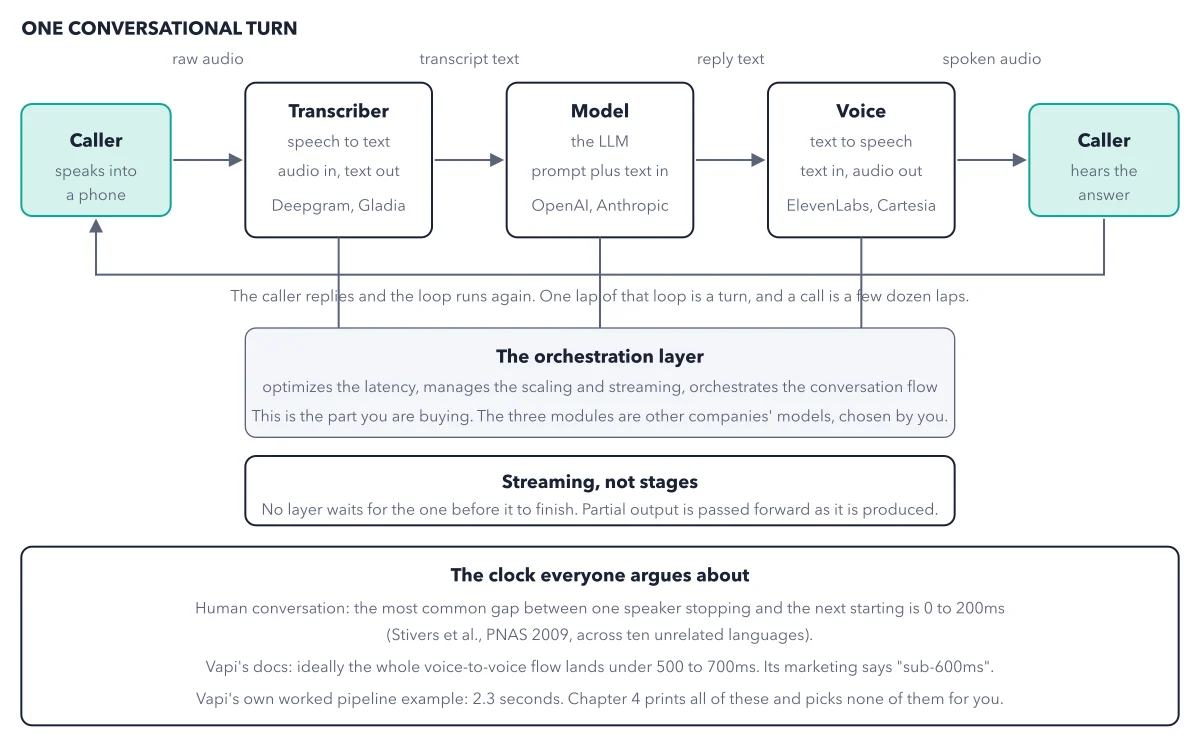
The three-hop pipeline
2026-09-03
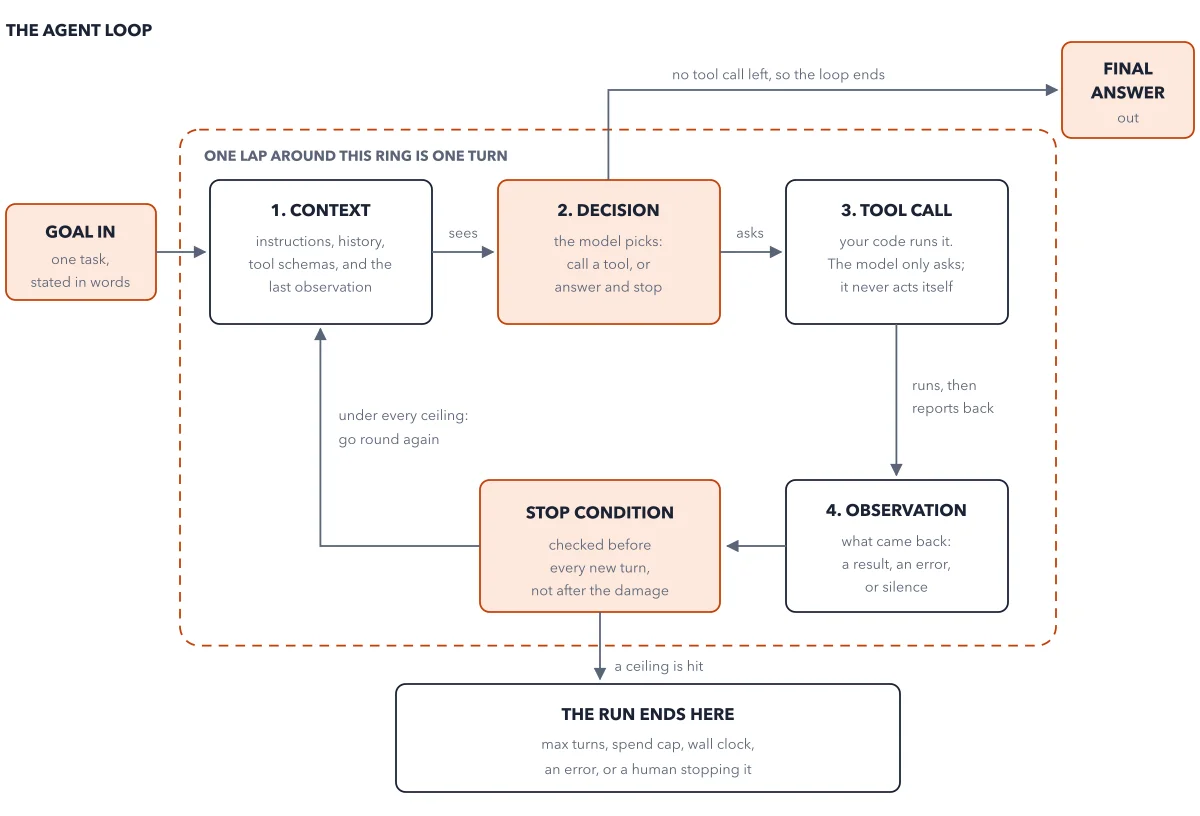
AI Agents
The agent loop, the anchor schema of this book
2026-09-02
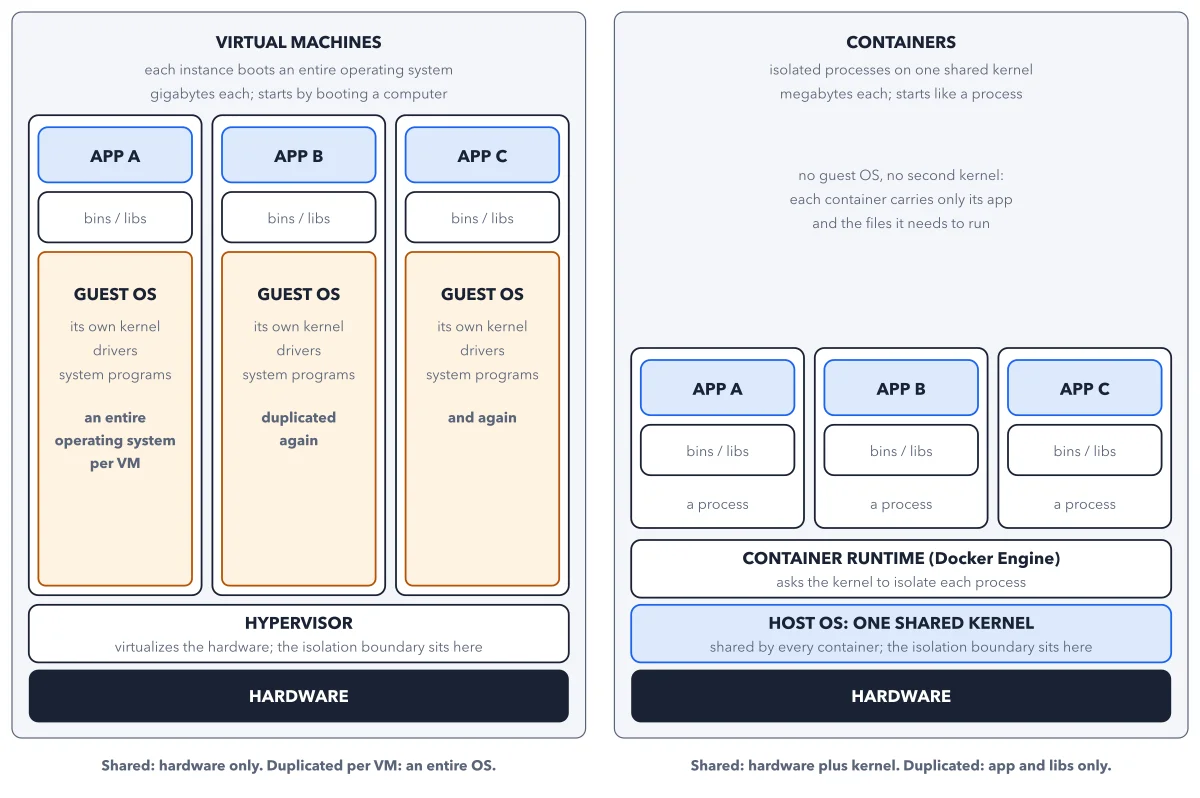
Docker
The anchor diagram of this book
2026-09-02
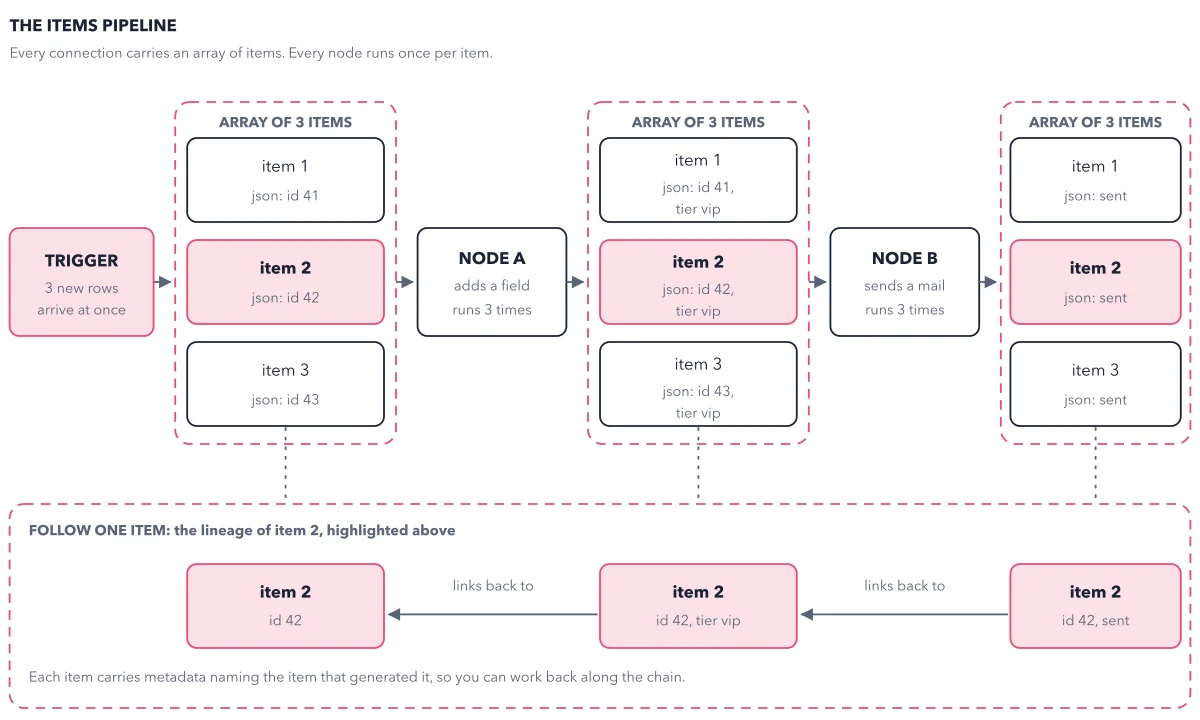
n8n
The items pipeline, the anchor schema of this book
2026-09-02
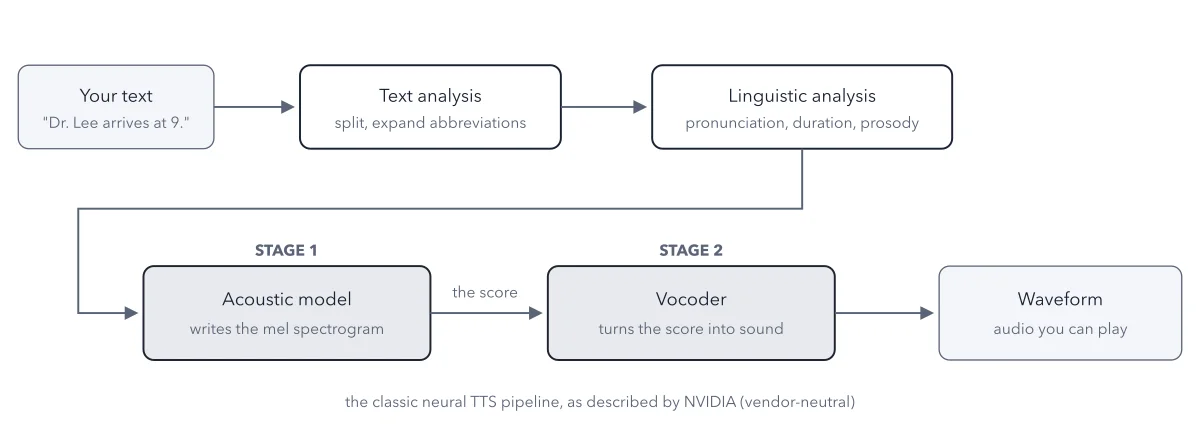
ElevenLabs
The two-stage neural TTS pipeline
2026-09-01
The +1 Method
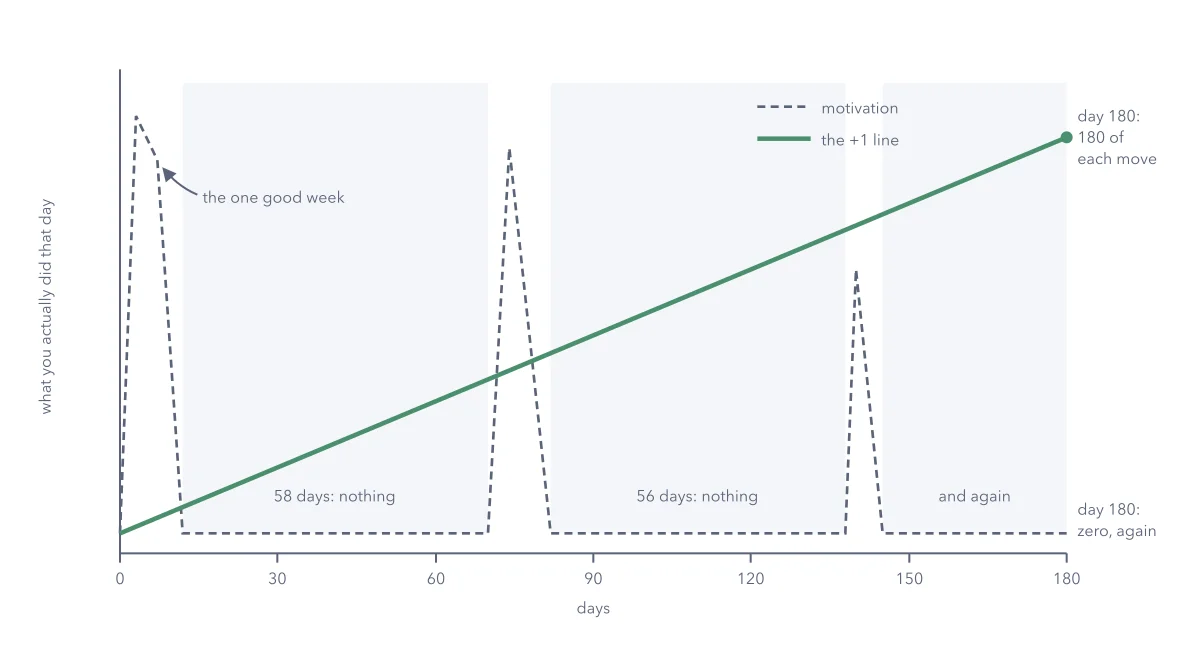
The same six months, two ways
2026-09-01
Tech Hiring
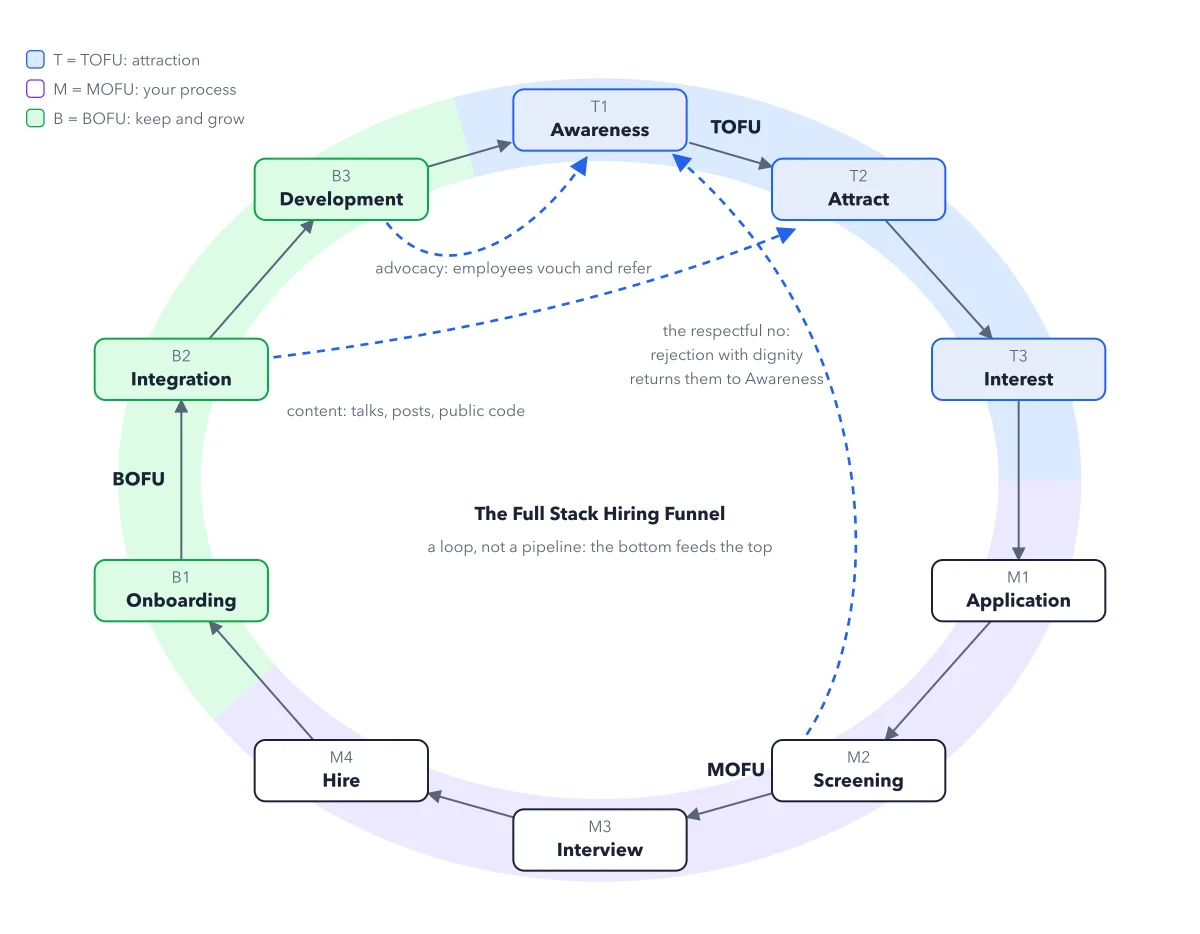
The Full Stack Hiring Funnel (the author's framework)
2026-09-01
AI
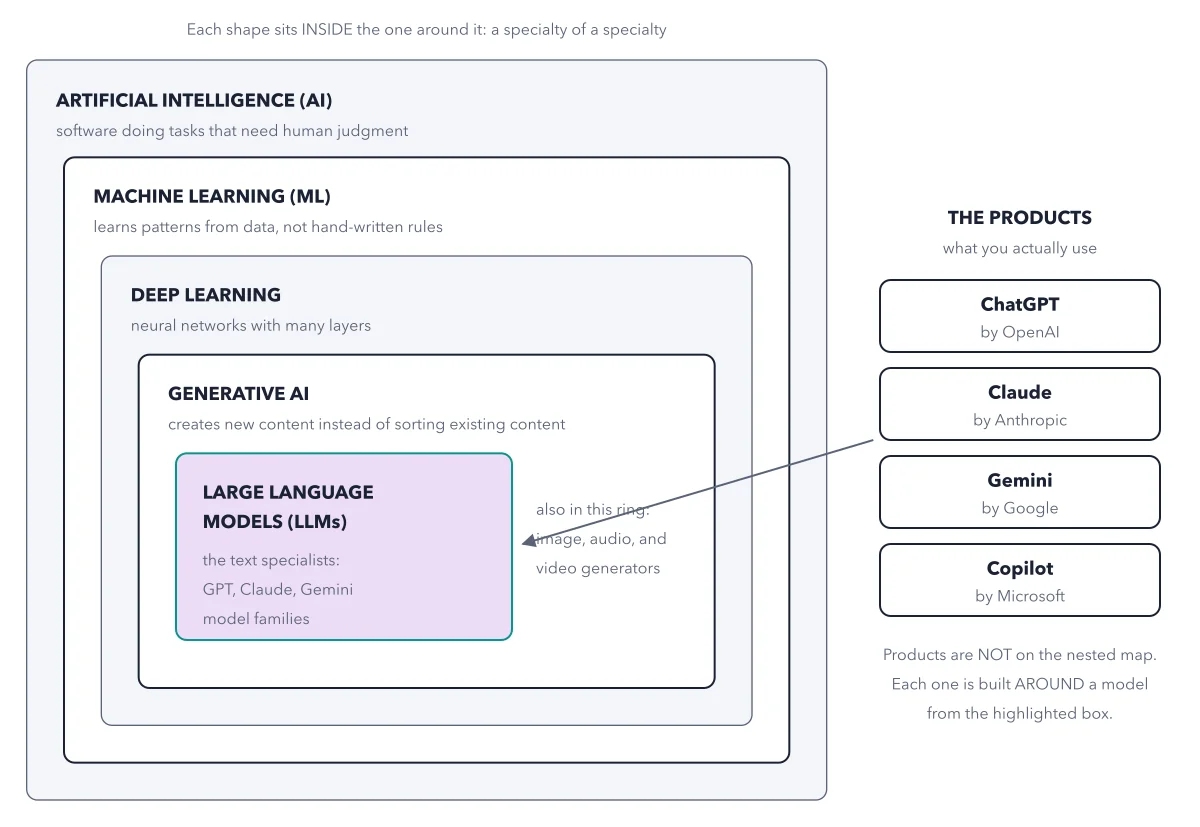
The family map
2026-08-31
Claude Code
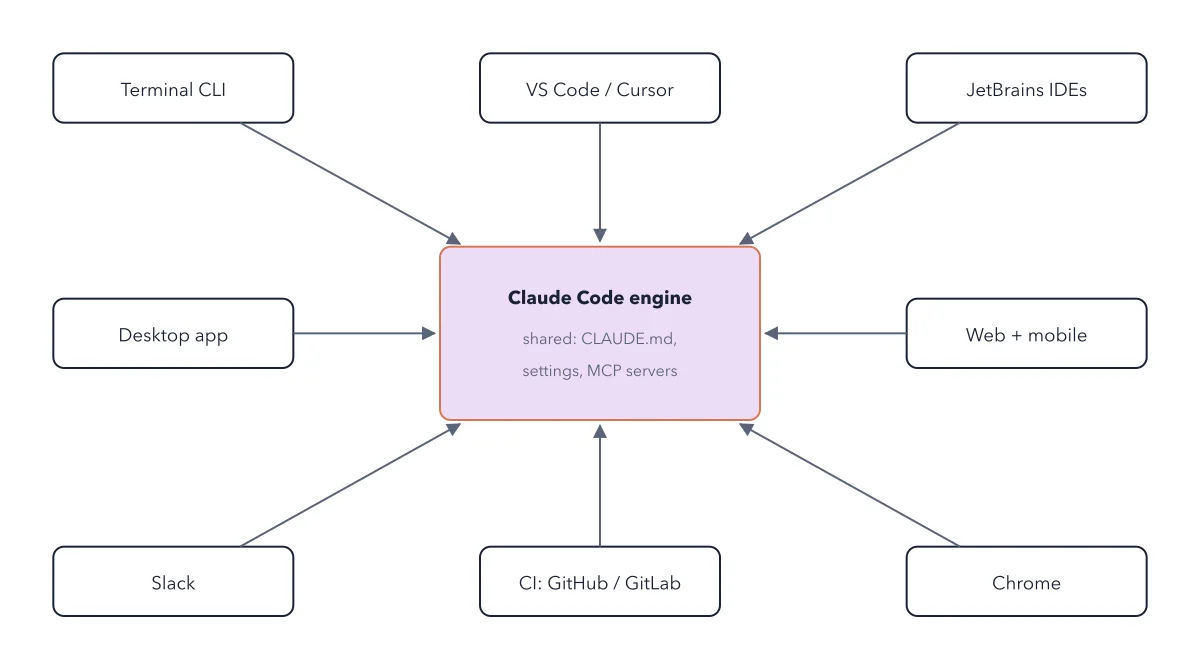
Every surface is a different doorway into the same engine
2026-08-31
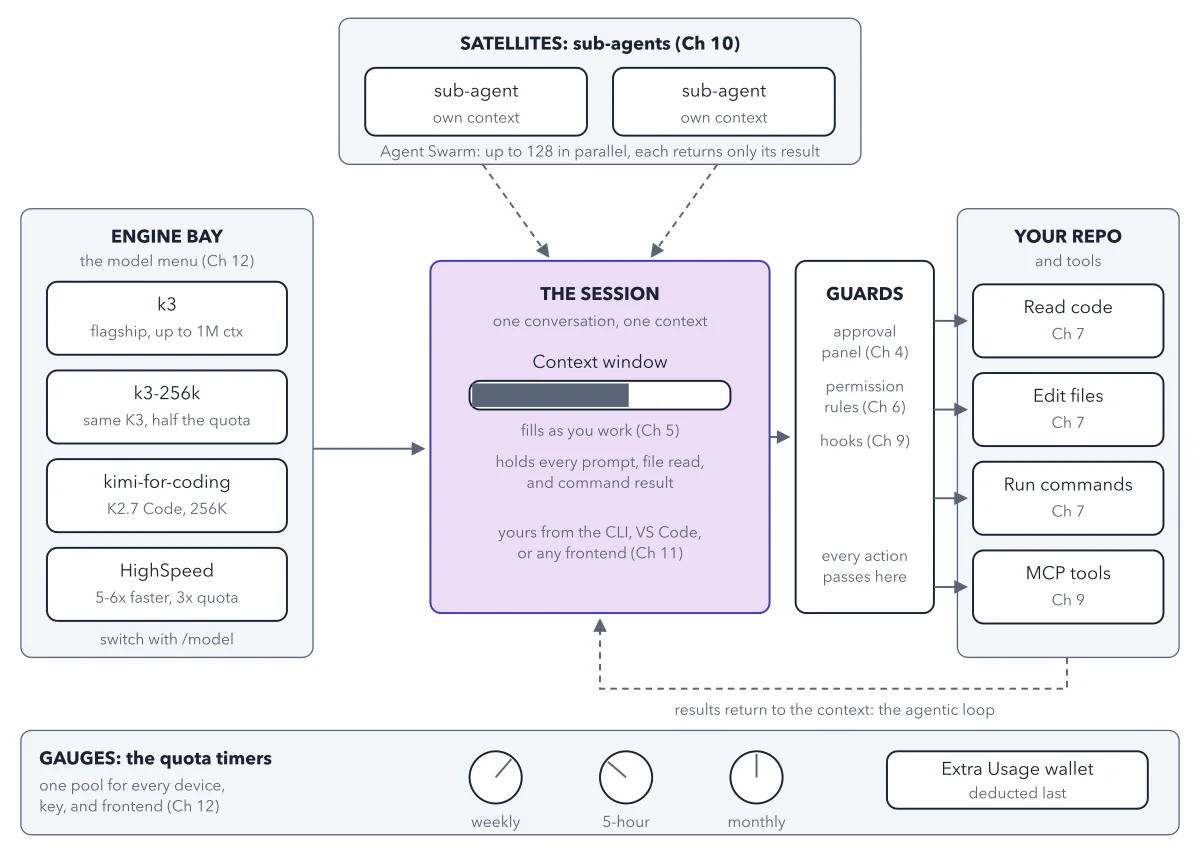
Kimi Code
The map of the machine
2026-08-31
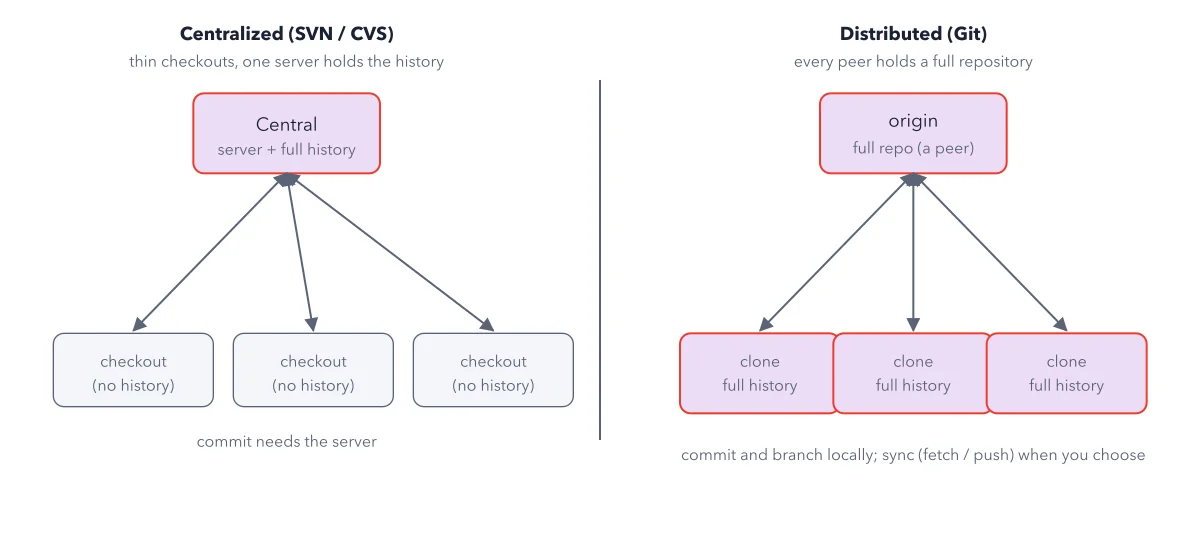
Git
Centralized vs distributed
2026-08-30
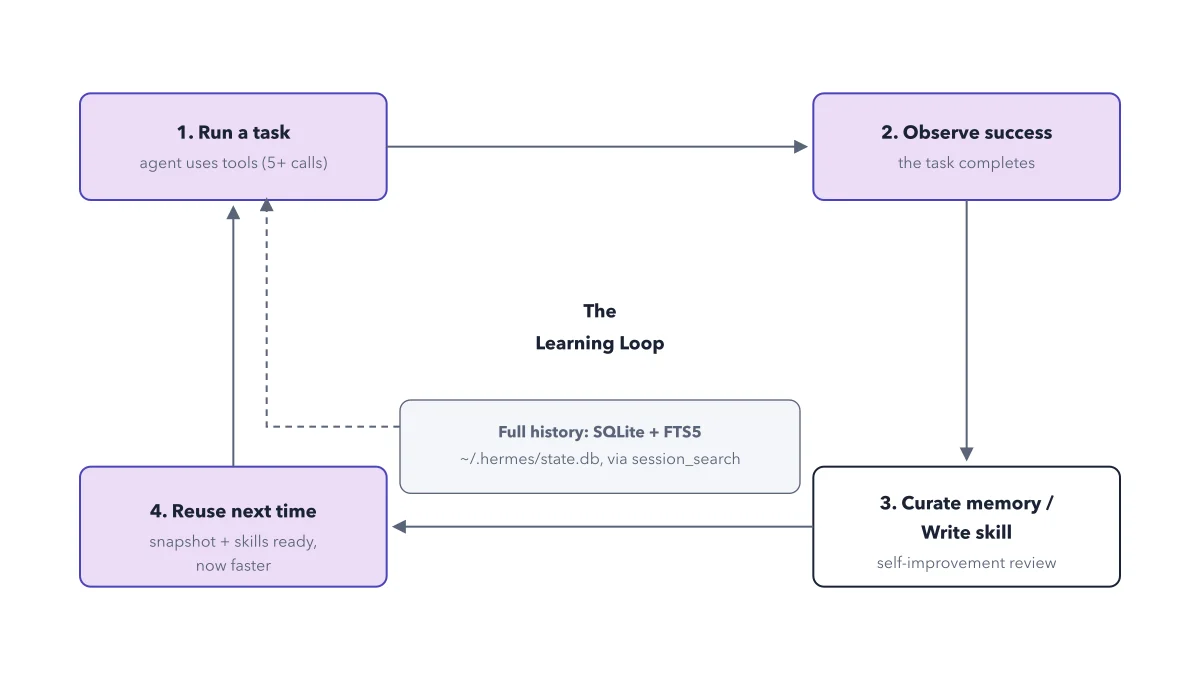
Hermes Agent
The learning loop
2026-08-30
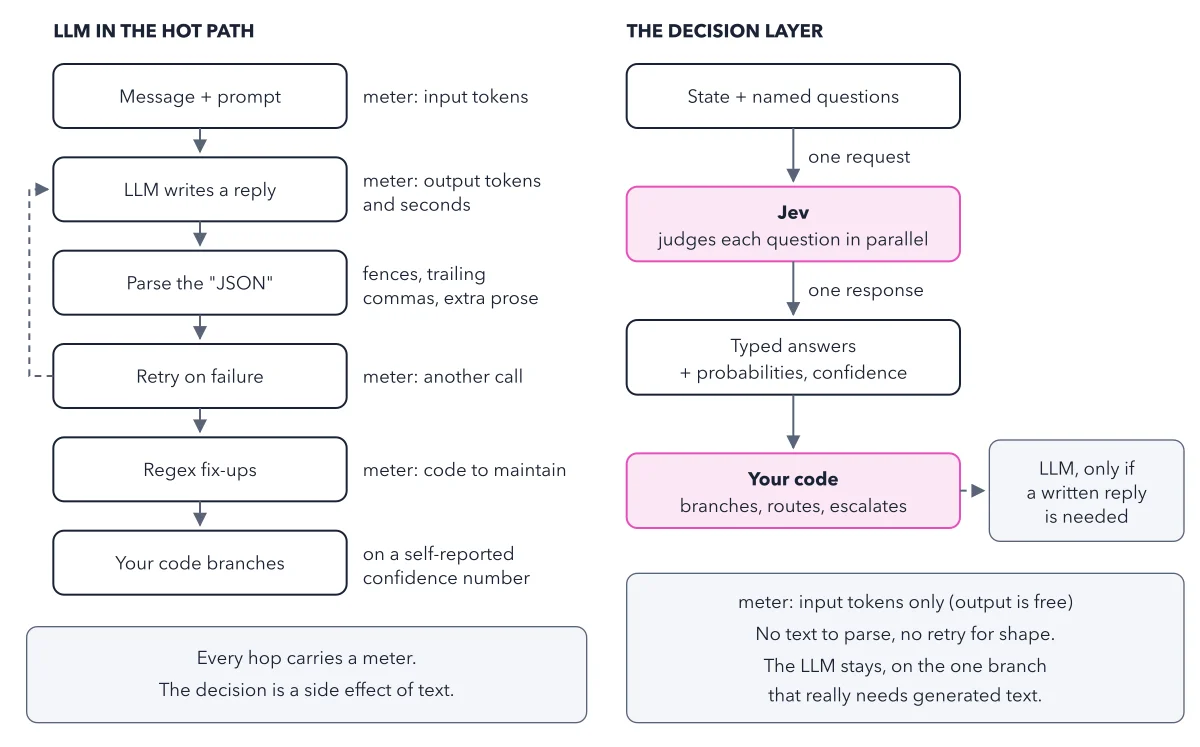
Jev
The LLM in the hot path versus the decision layer
2026-08-30
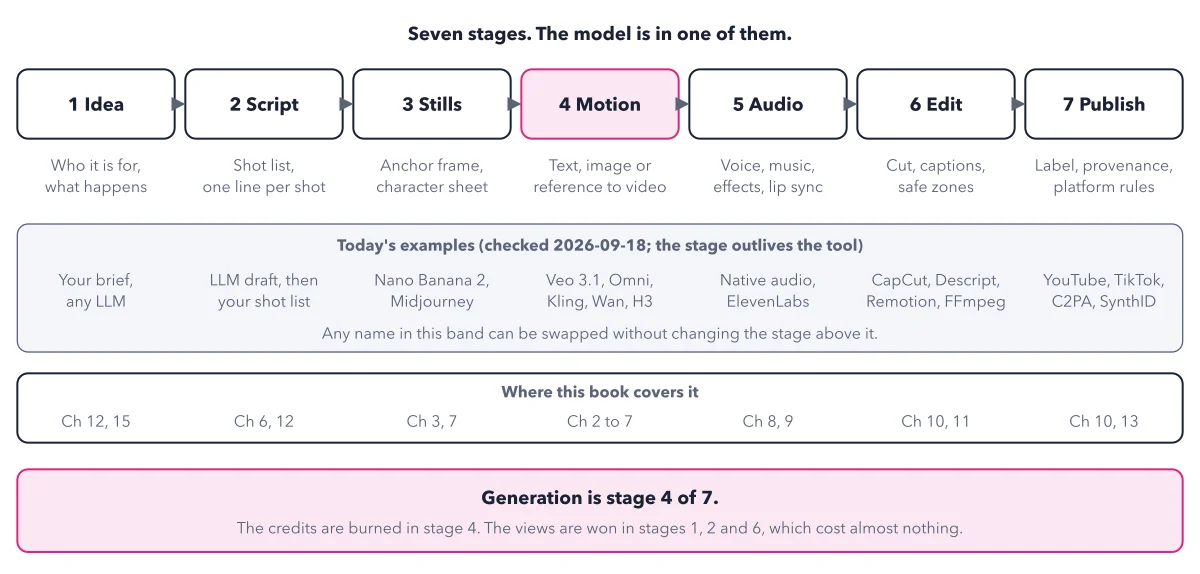
AI Video
The AI video stack
2026-08-29
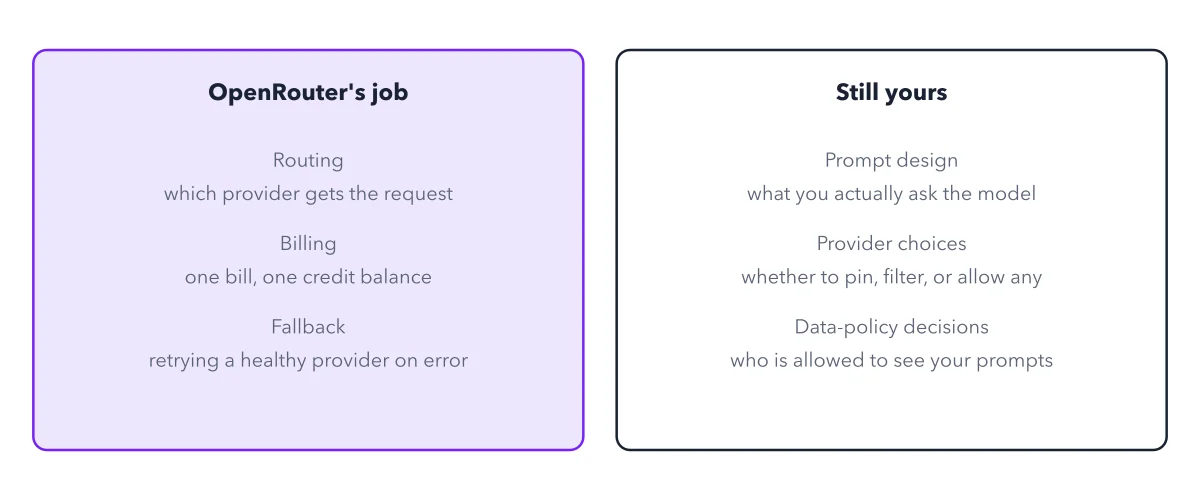
OpenRouter
What OpenRouter's job is, and what stays yours
2026-08-29
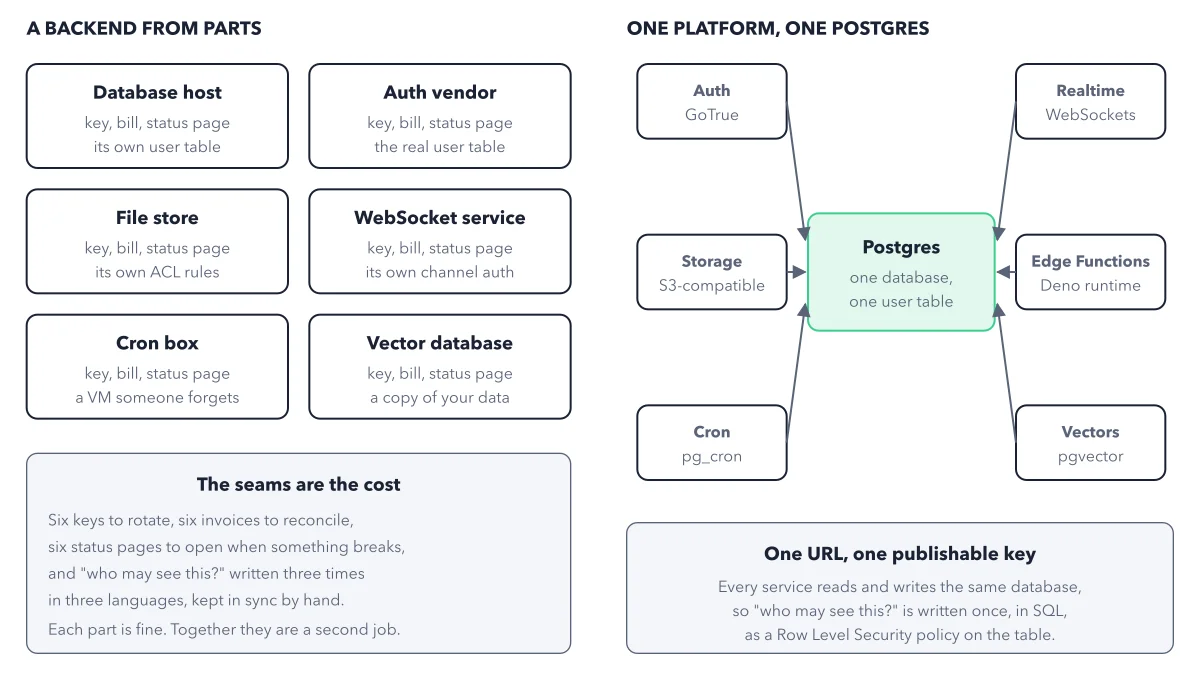
Supabase
A backend from parts versus one platform
2026-08-29
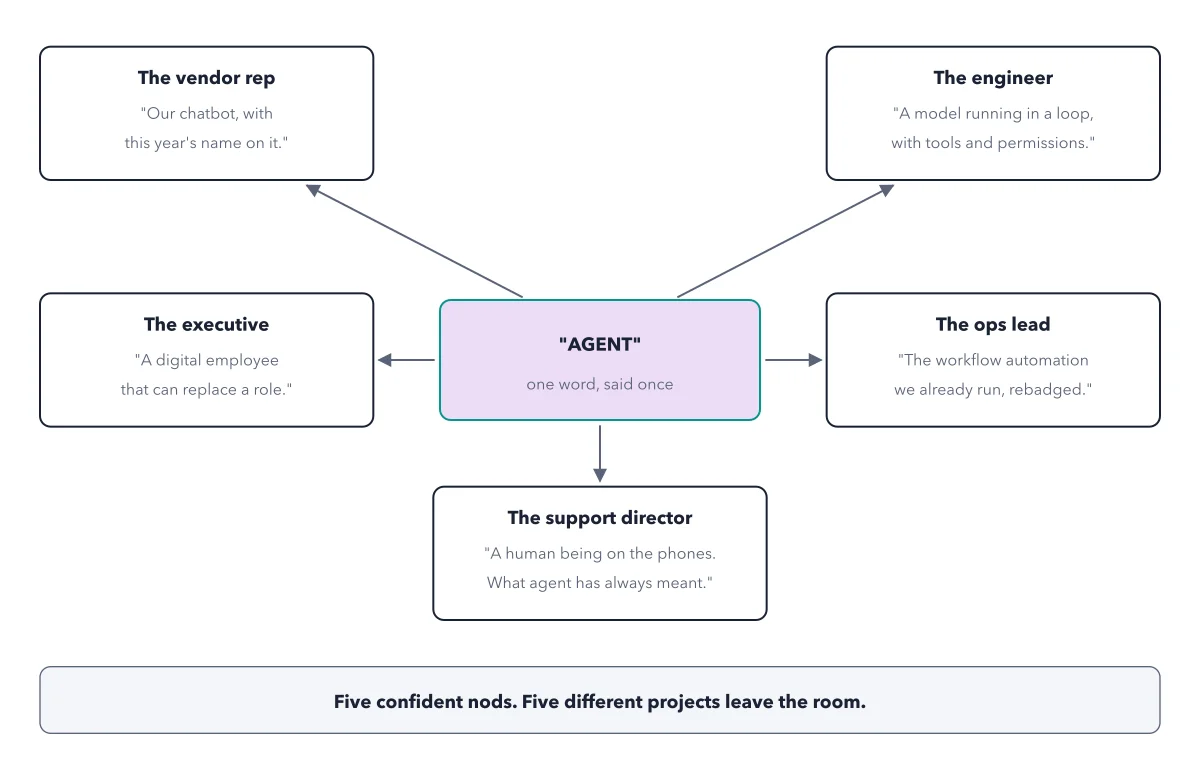
AI
The terminology fog
2026-08-27
AI Agents
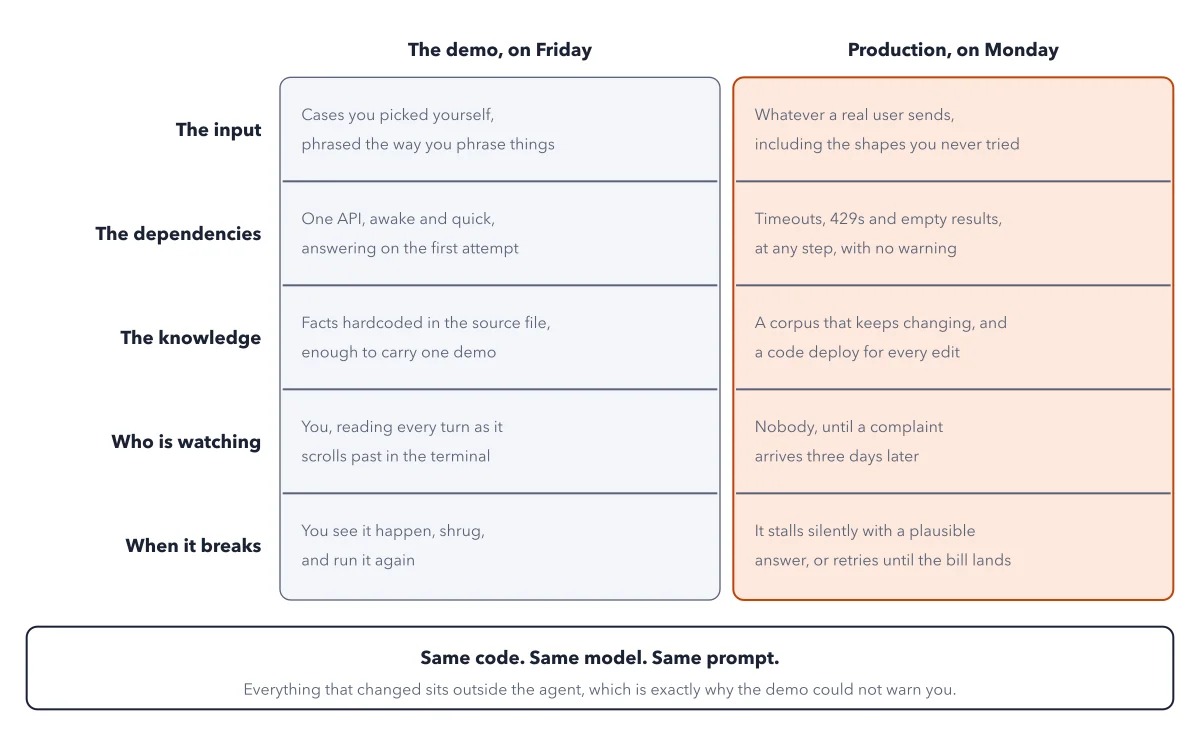
The demo-to-production gap
2026-08-27
Claude Code
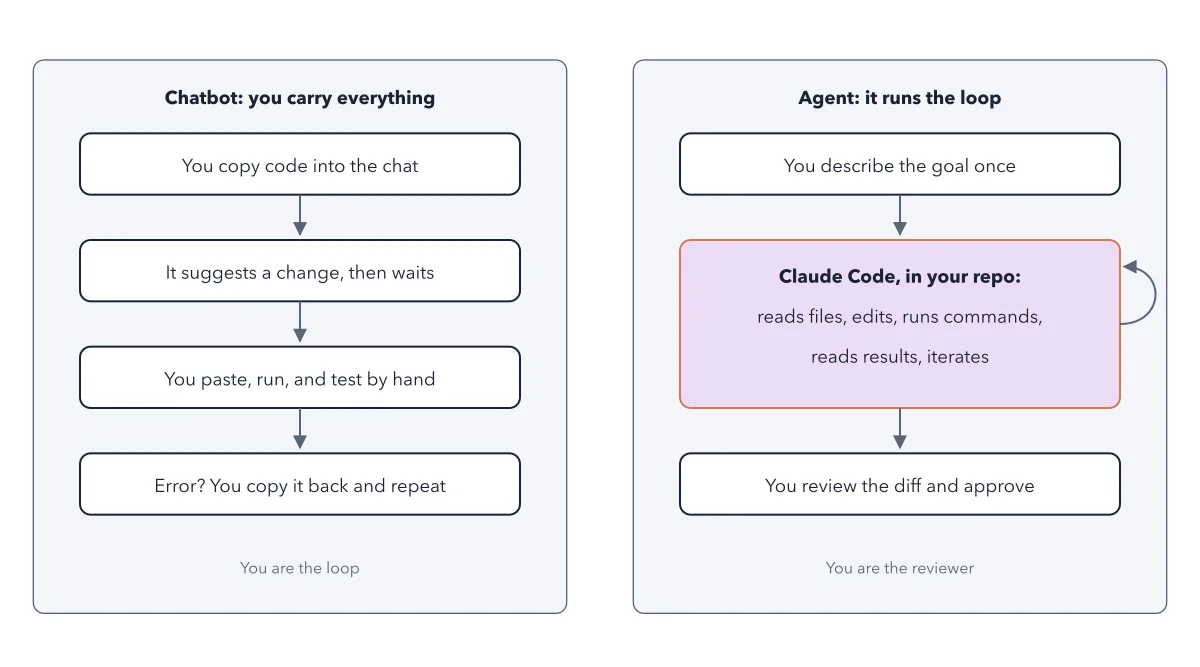
The chat workflow routes every step through you
2026-08-27
OpenAI Codex
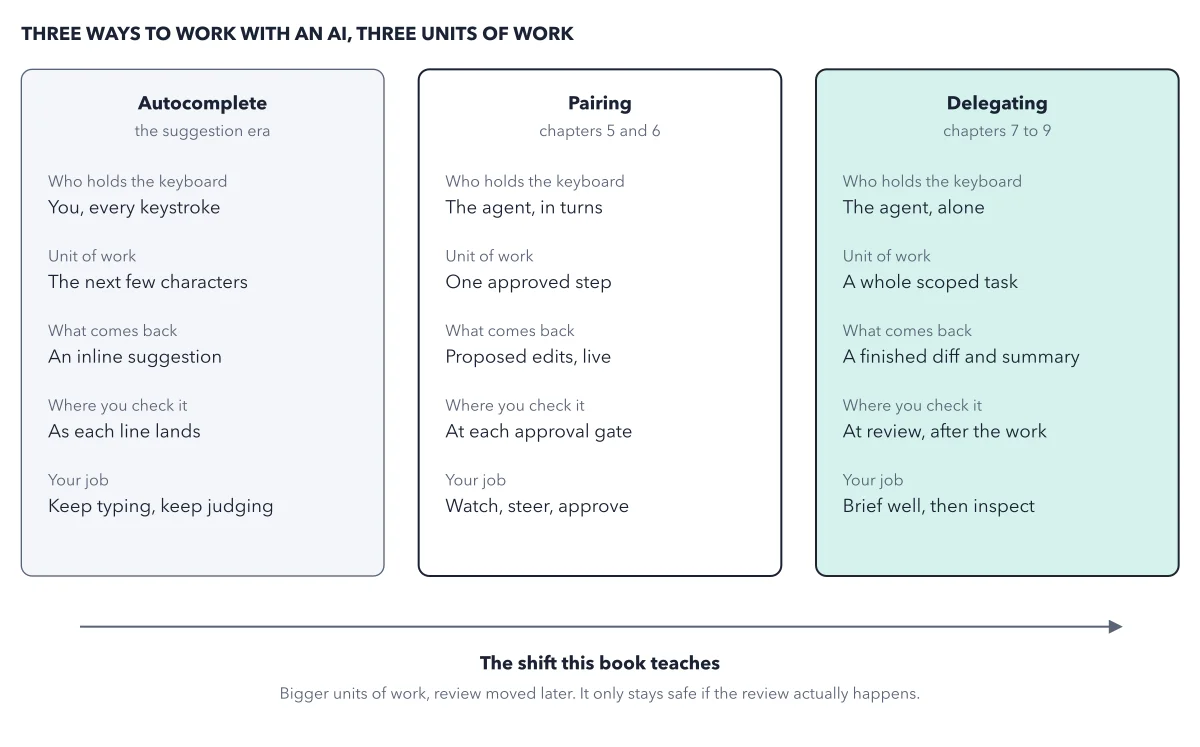
Three lanes, three units of work
2026-08-27
Cursor
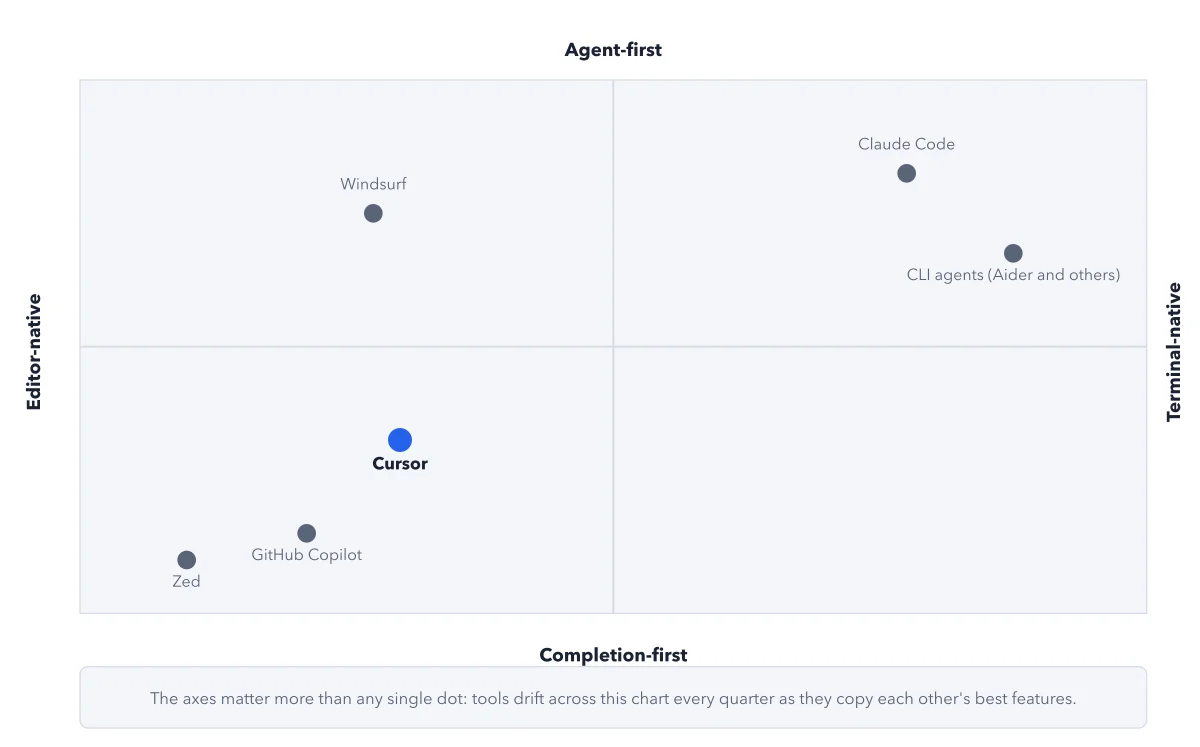
The tool landscape
2026-08-27
DeepSeek
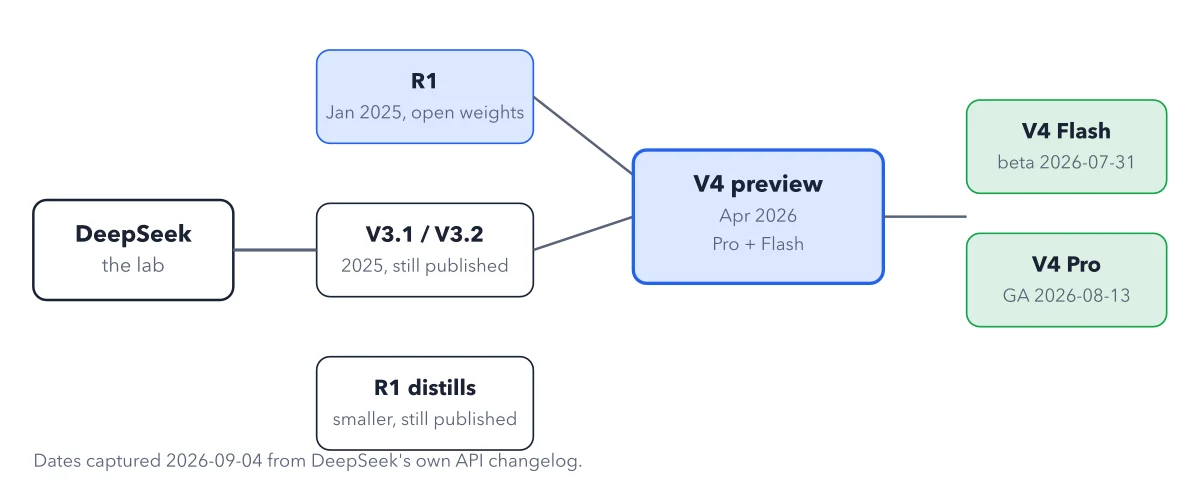
DeepSeek's model family tree
2026-08-27
Docker
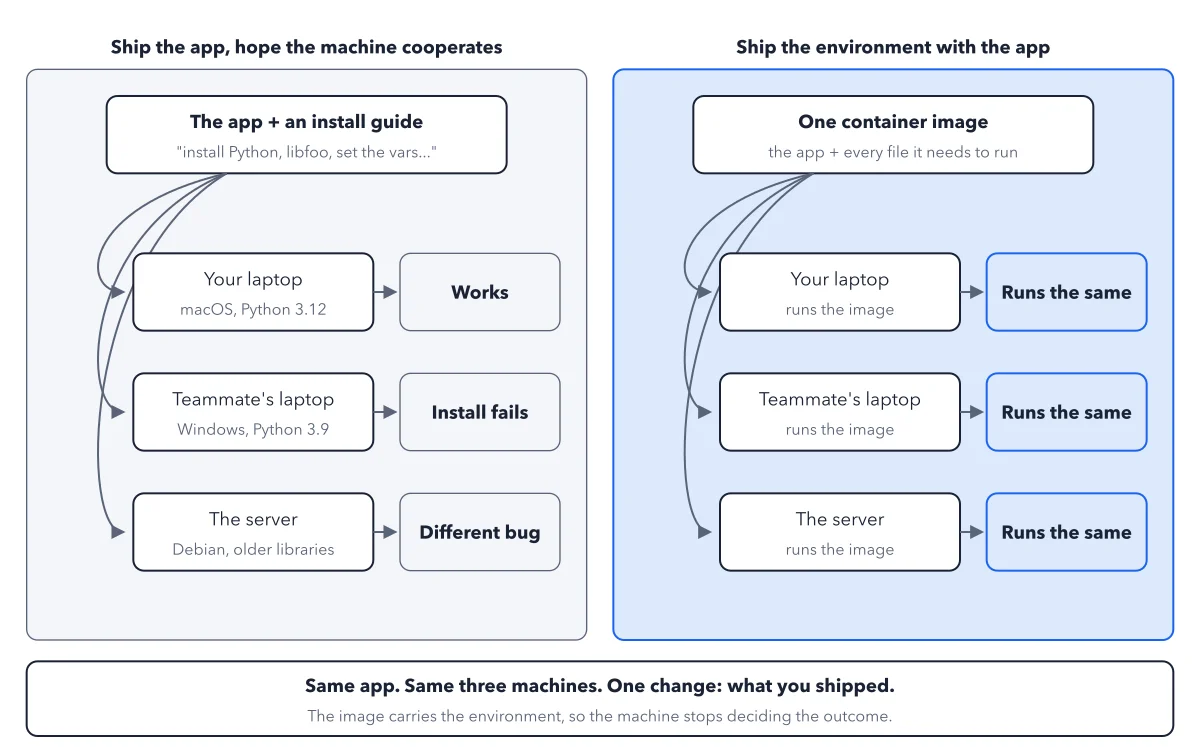
The problem Docker solves
2026-08-27
ElevenLabs
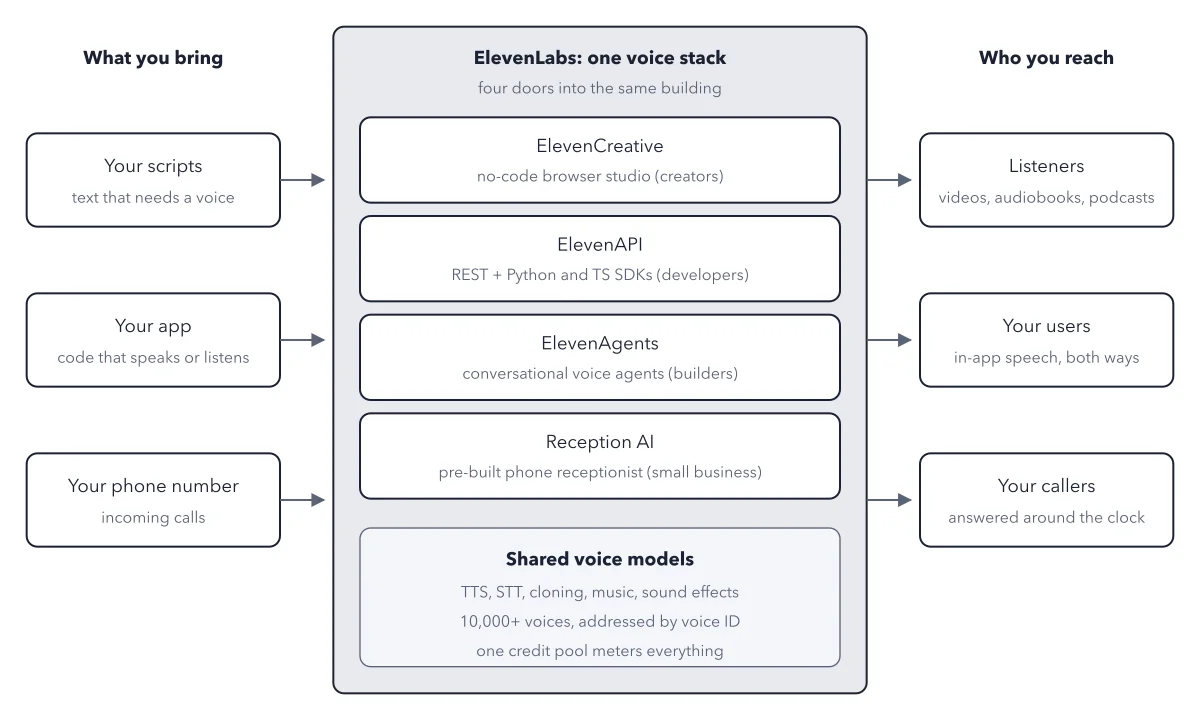
Where ElevenLabs sits in your stack
2026-08-27
Fly.io
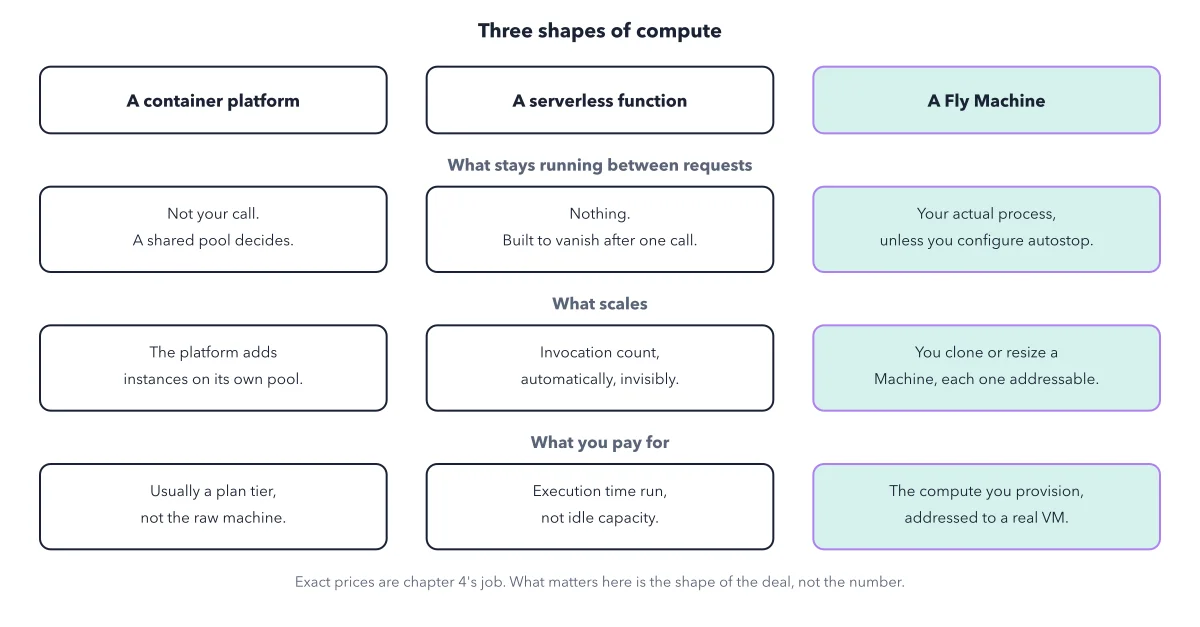
Three shapes of compute compared
2026-08-27
Gemini
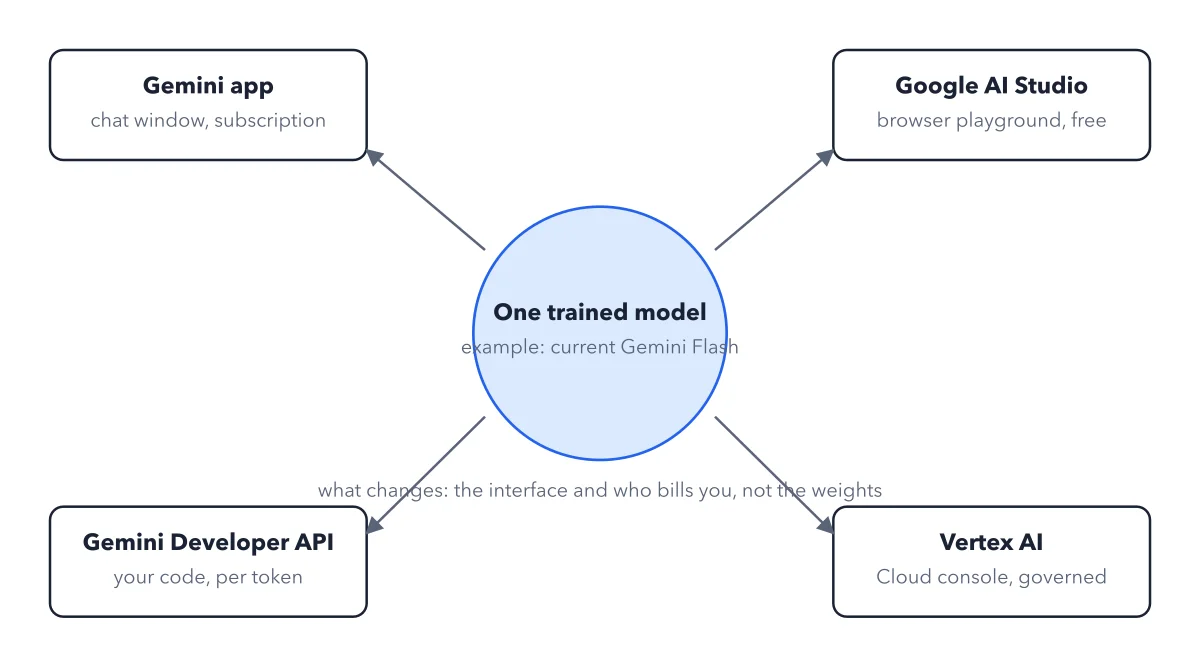
What is a model, what is a product
2026-08-27
Git
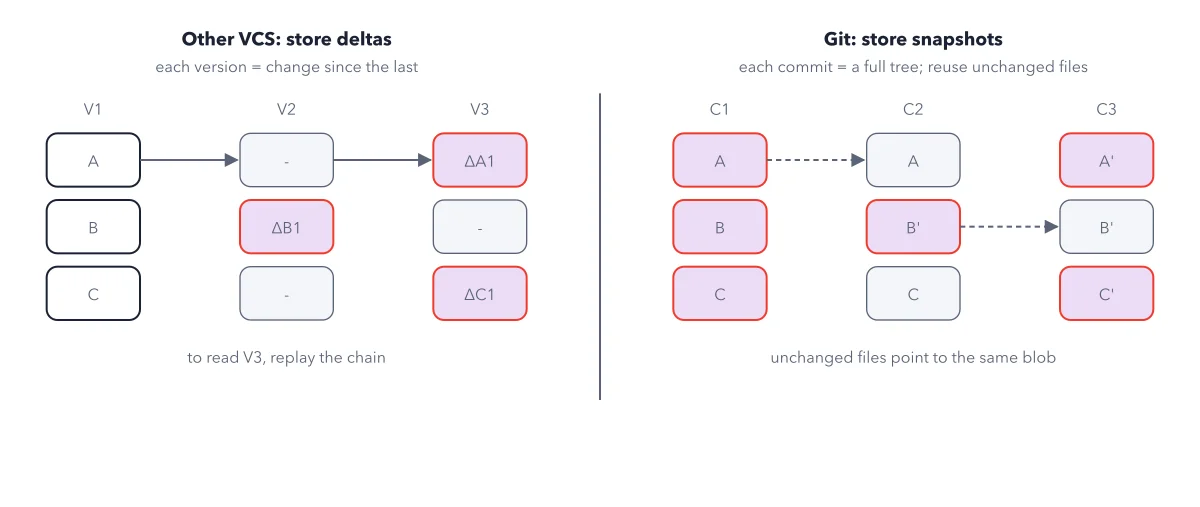
Snapshots vs diffs
2026-08-27
GitHub
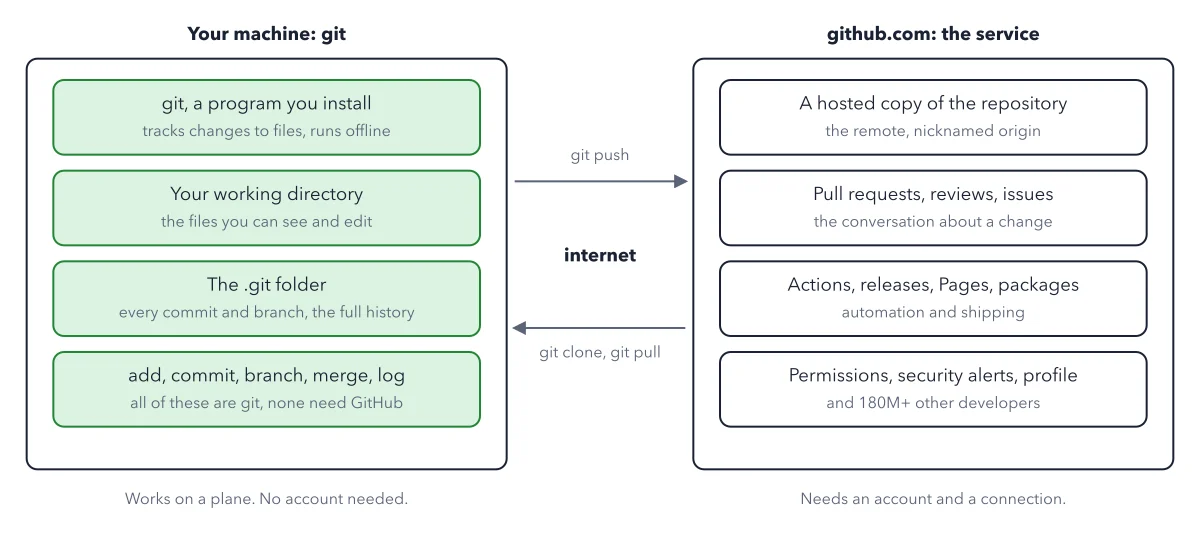
The split
2026-08-27
GLM
2026-08-27
Grok Bot
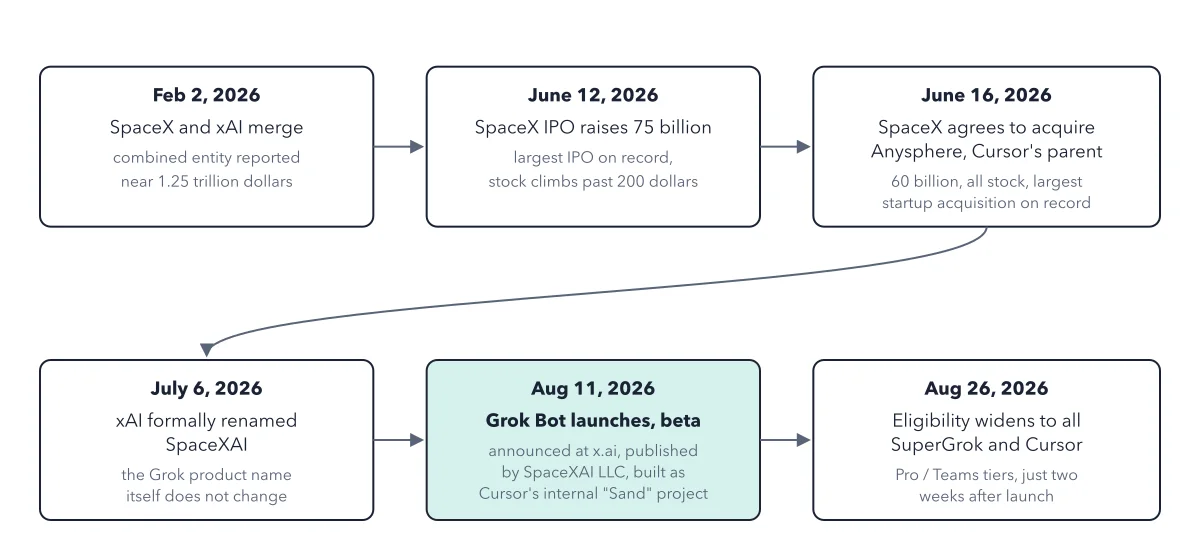
The two events that meet at Grok Bot
2026-08-27
Hermes Agent
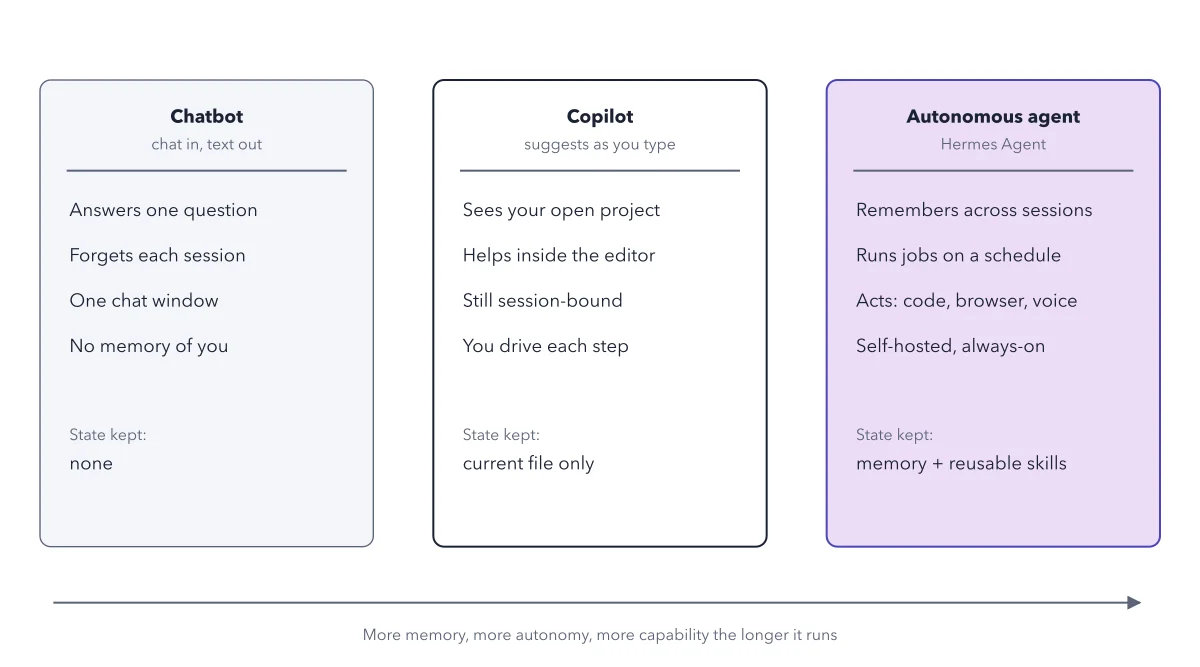
The same question ("help me with my server") lands very differently across the three
2026-08-27
Hugging Face
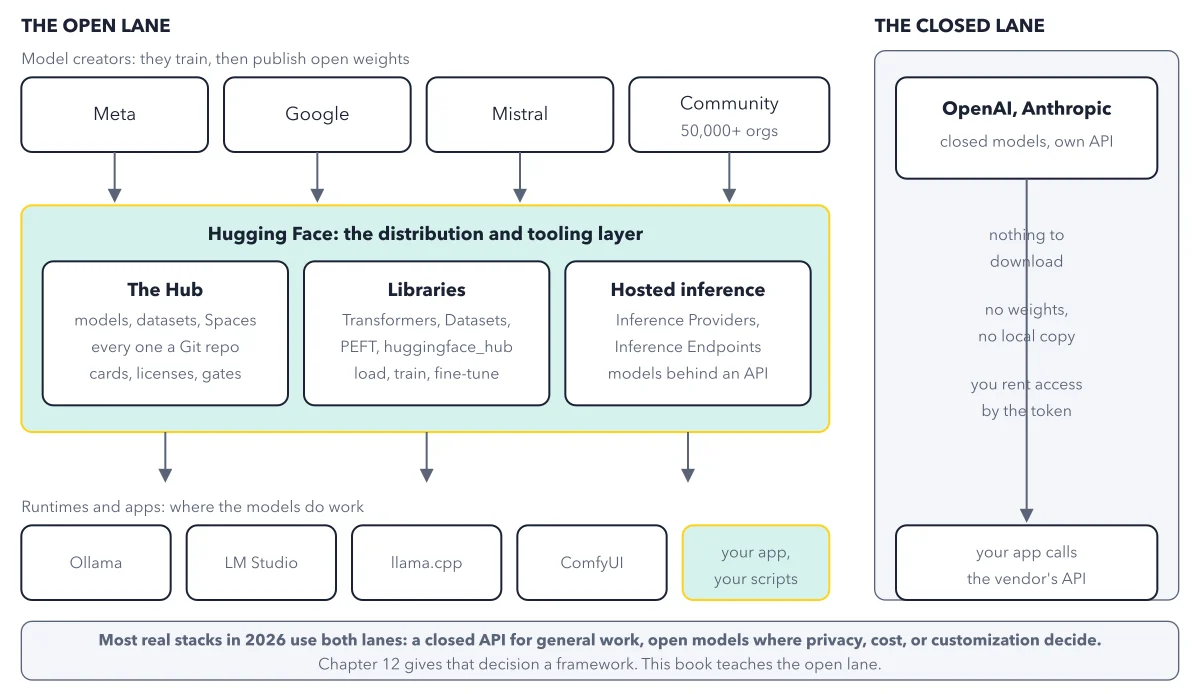
Where Hugging Face sits
2026-08-27
Kimi Code
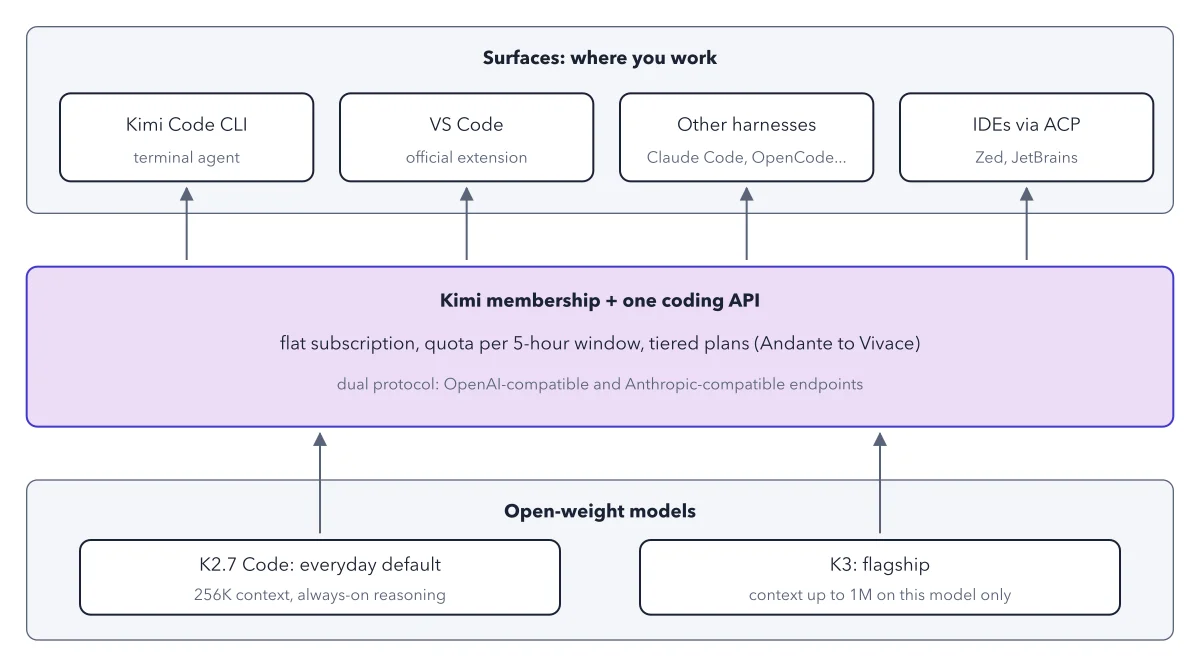
The Kimi Code stack
2026-08-27
Llama
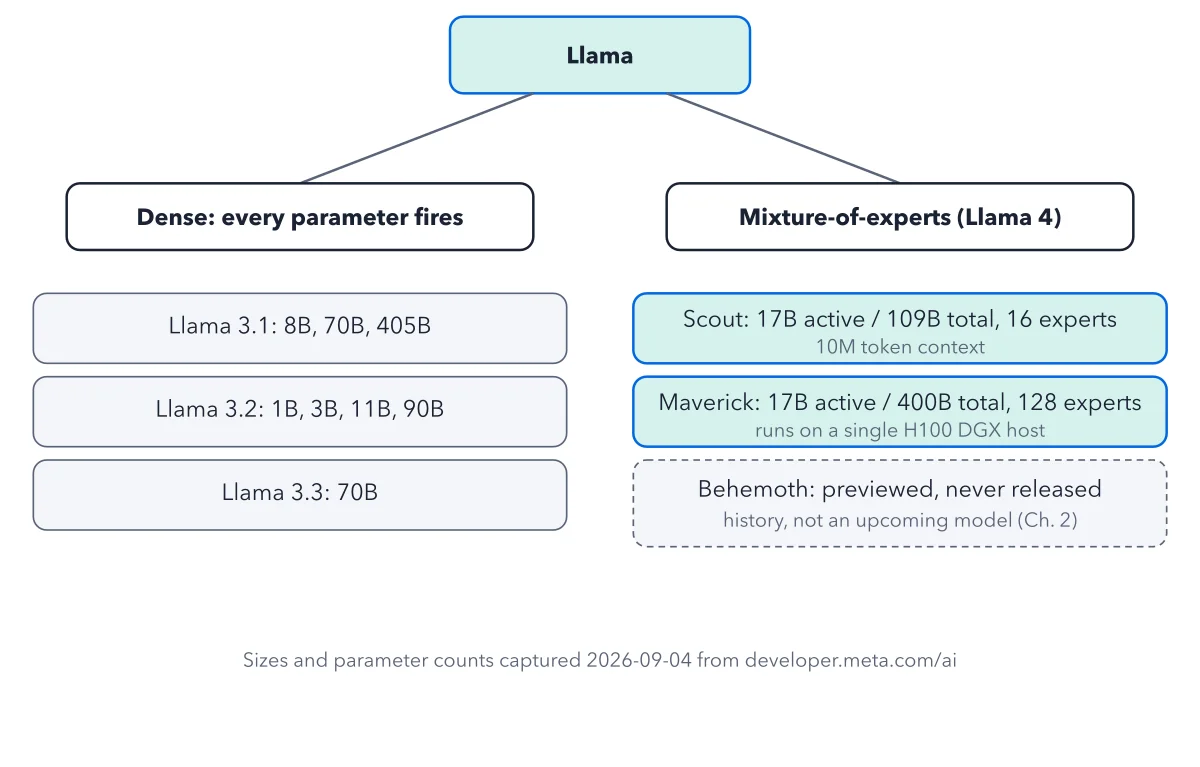
The Llama family tree, from dense Llama 3.x through the mixture-of-experts Llama 4...
2026-08-27
Lovable
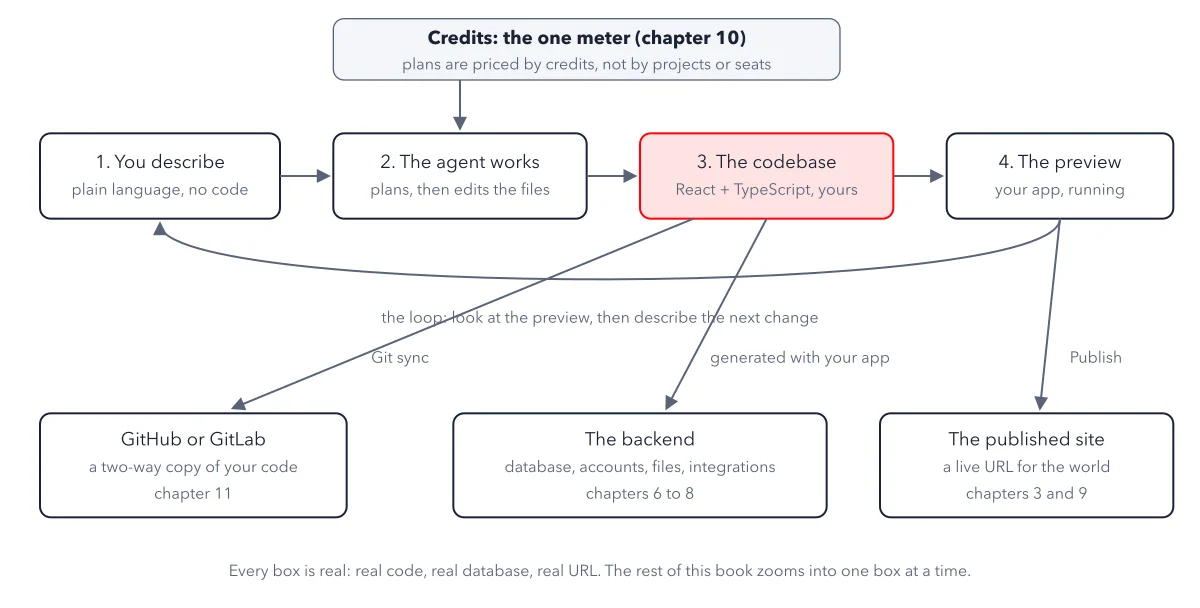
The loop
2026-08-27
Make.com
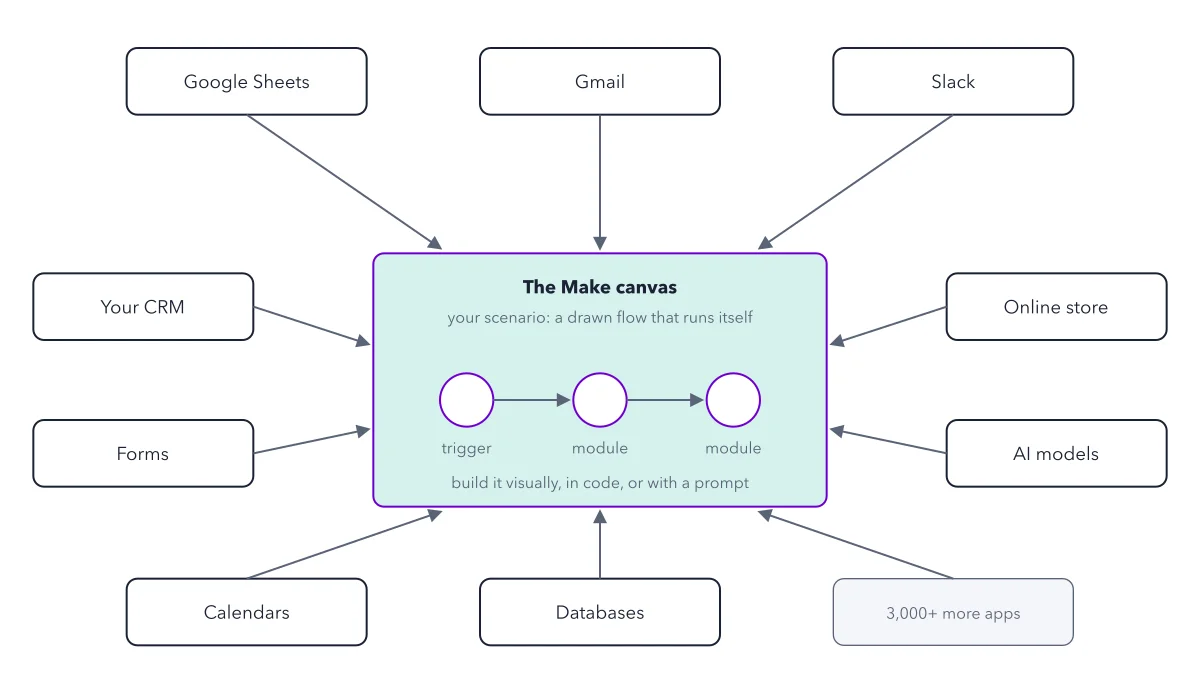
The platform map
2026-08-27
Mistral
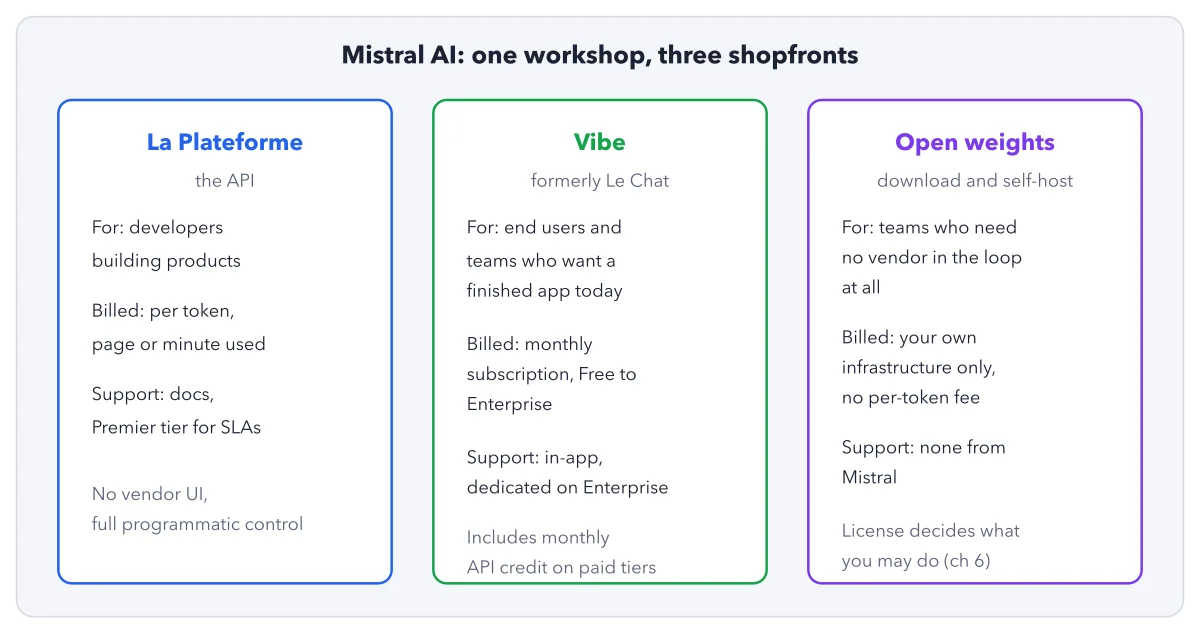
One company, three products, drawn against who each is for and what it costs
2026-08-27
Modal
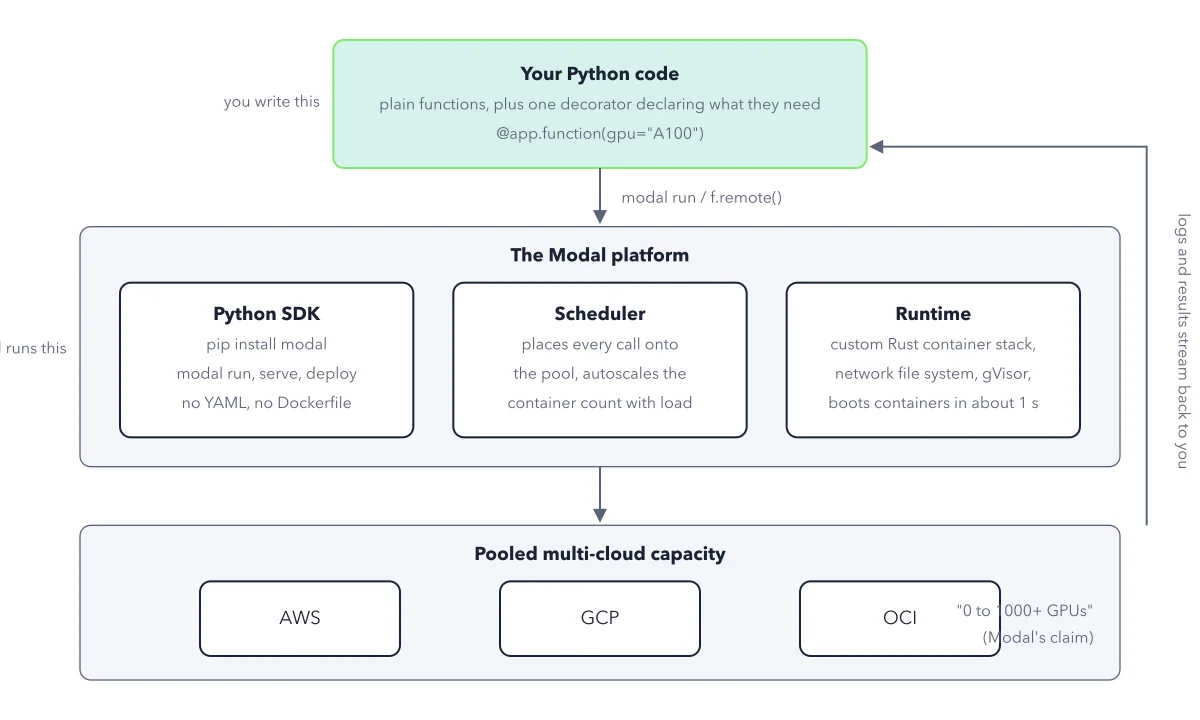
Where Modal sits
2026-08-27
n8n
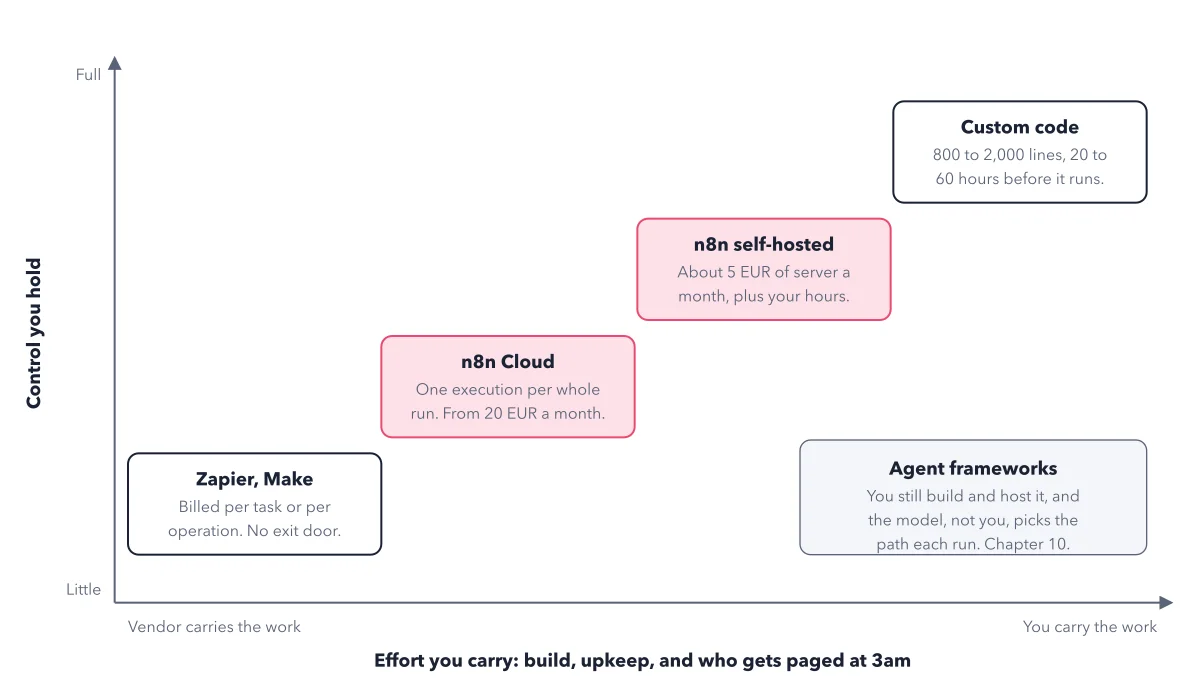
Where n8n sits
2026-08-27
OpenClaw
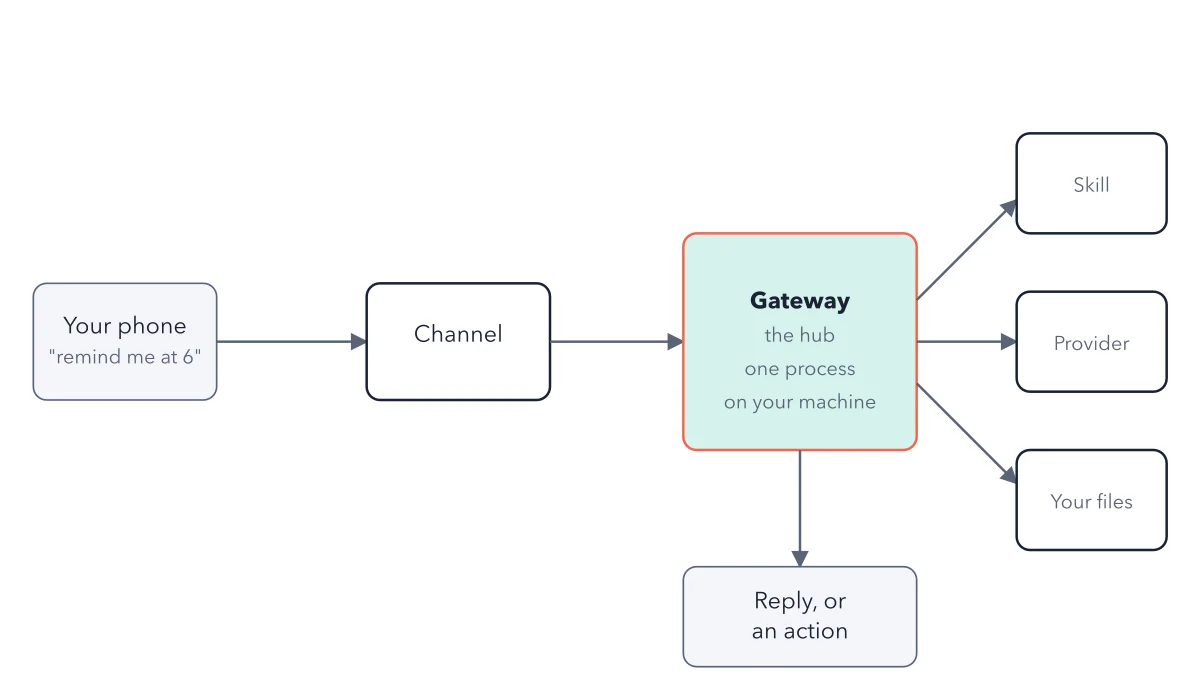
The four nouns
2026-08-27
The +1 Method
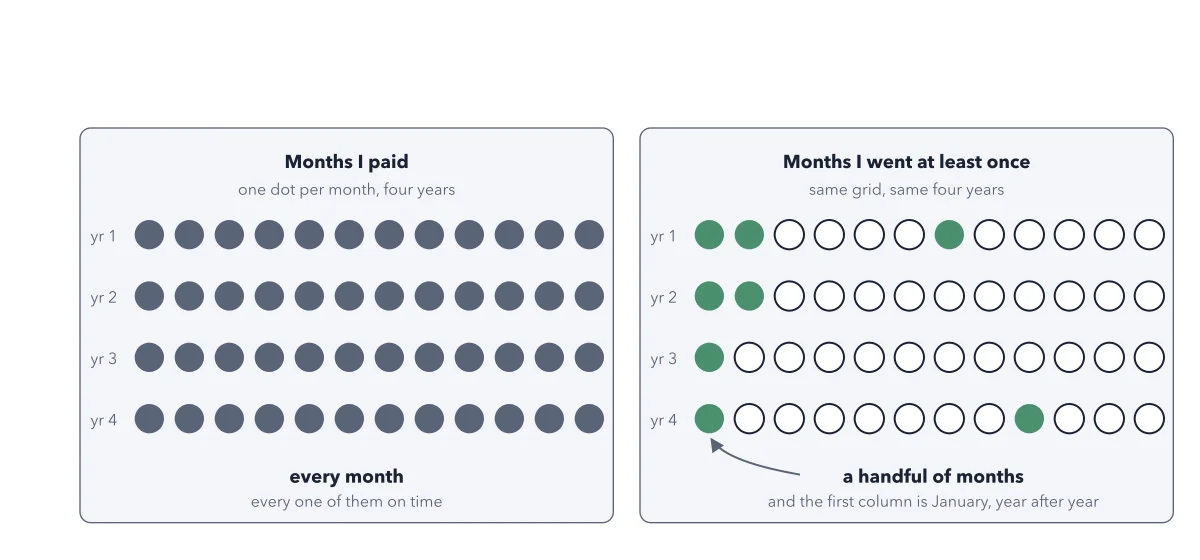
Four years of that membership, one dot per month
2026-08-27
Qwen
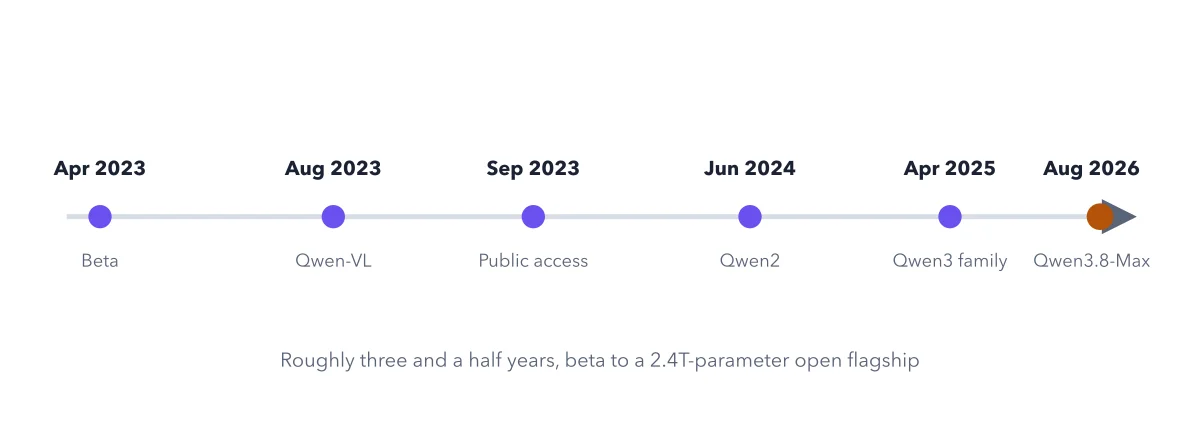
Qwen's public timeline, April 2023 to August 2026, per Wikipedia's community-sourced...
2026-08-27
Tech Hiring
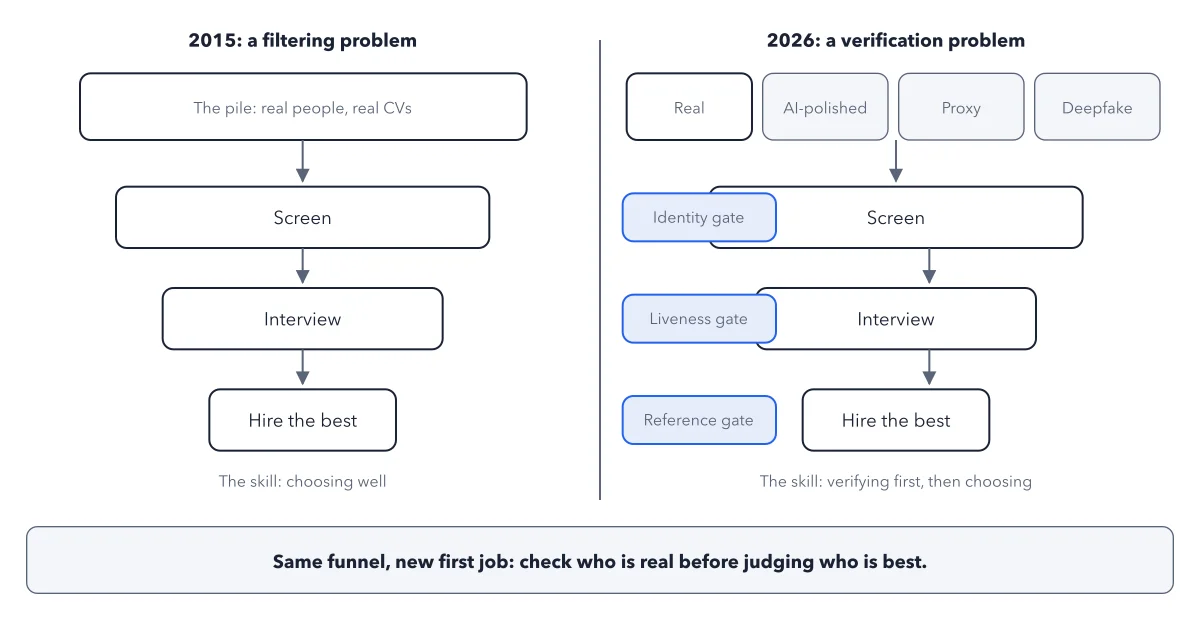
Filtering vs verification
2026-08-27
Vapi
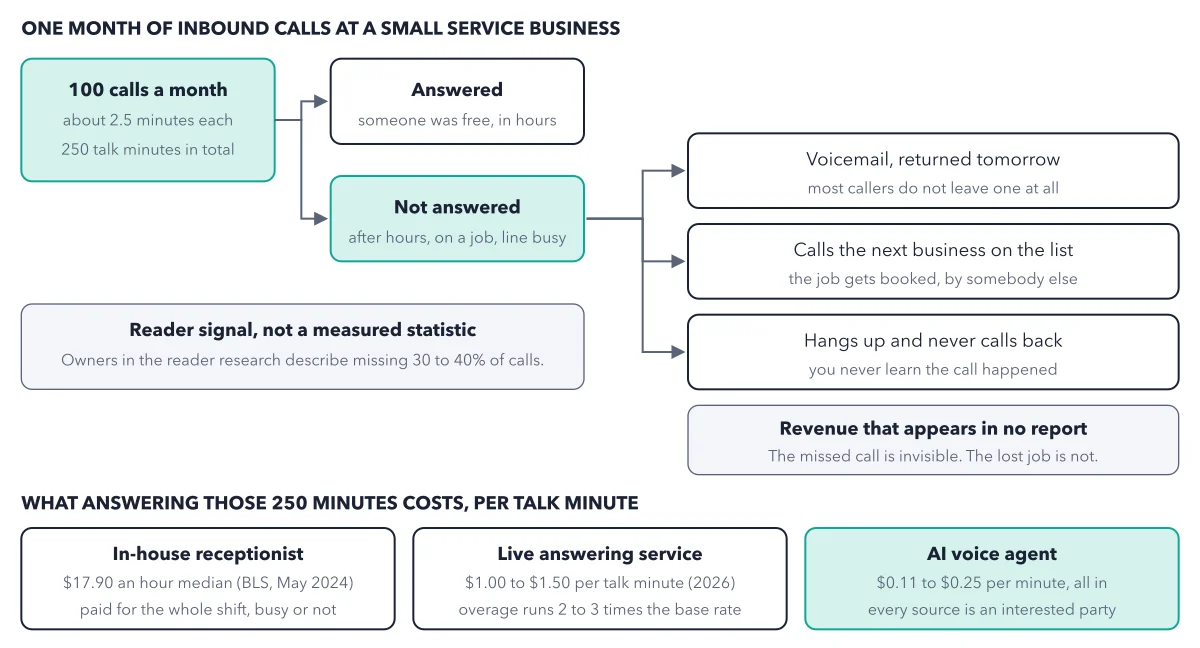
The missed-call problem, drawn as money leaving
2026-08-27
Vercel
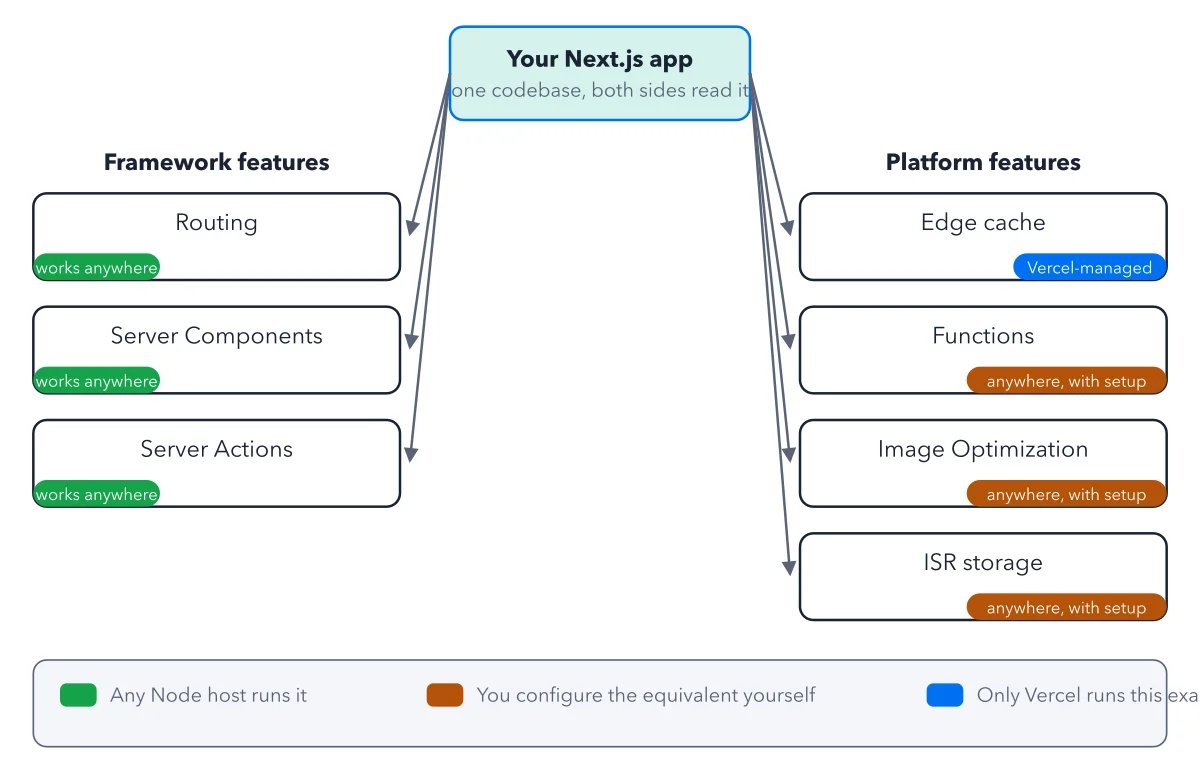
The boundary diagram
2026-08-27
Zernio
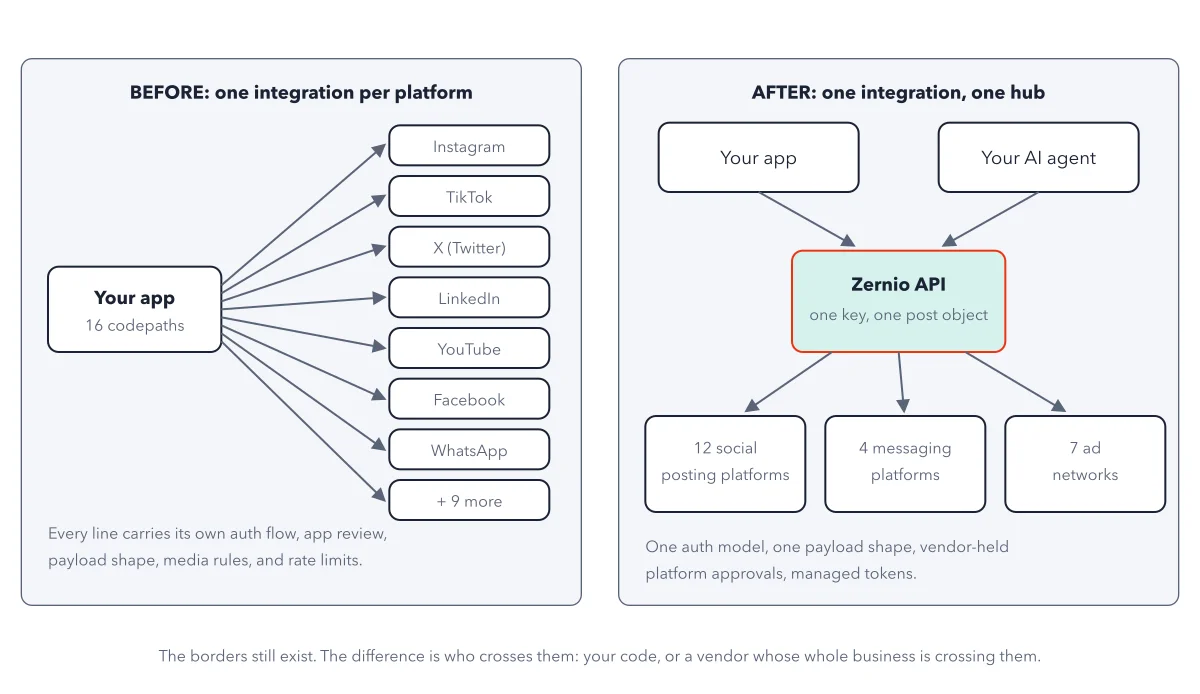
Sixteen direct integrations versus one hub
2026-08-27