Qwen Made Crystal Clear · chapter 5: What Qwen Actually Costs
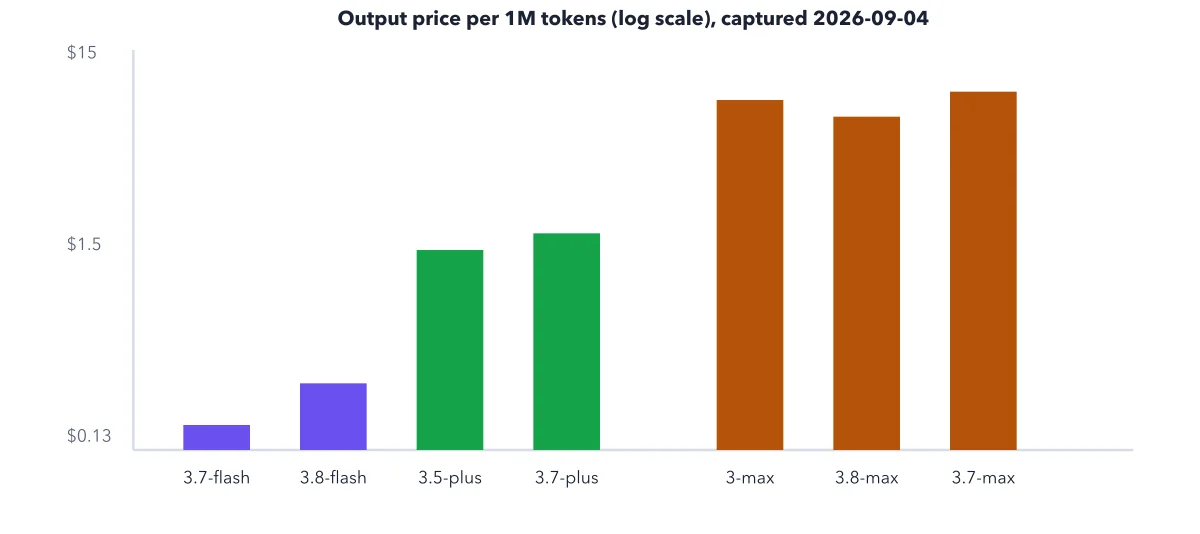
The price ladder from Flash to Max, output rate per million tokens, log scale
2026-10-11
Note qwen3.8-max sits lower than qwen3.7-max, the model it replaced.
Below: the paragraph from the book that builds this idea, then the diagram itself (Figure 5.1), and a recap. About a minute of reading.
Notice the shape of the table itself: several models (qwen3-max, qwen3.7-plus, qwen3.5-plus) price by context length, so the per-token rate rises as your conversation or document grows past certain thresholds. The current-generation flagship and Flash model (qwen3.8-max, qwen3.8-flash) are flat instead, one rate regardless of how long the context gets. Know which kind of pricing applies to the specific model you are calling before you estimate a bill; a tiered model can cost noticeably more than its lowest listed rate once a conversation runs long.
Recap
- The idea: Note qwen3.8-max sits lower than qwen3.7-max, the model it replaced.
- The picture: Figure 5.1, from chapter 5 ("What Qwen Actually Costs") of Qwen Made Crystal Clear.
- Go deeper: the chapter builds this step by step, with recipes and sources at the end.
This diagram is one of many in Qwen Made Crystal Clear.
Every chapter opens with the gist, draws the hard ideas, and ends with recipes and sources.
Get the book