Tech Hiring Made Crystal Clear · chapter 2: The Full Stack Hiring Funnel
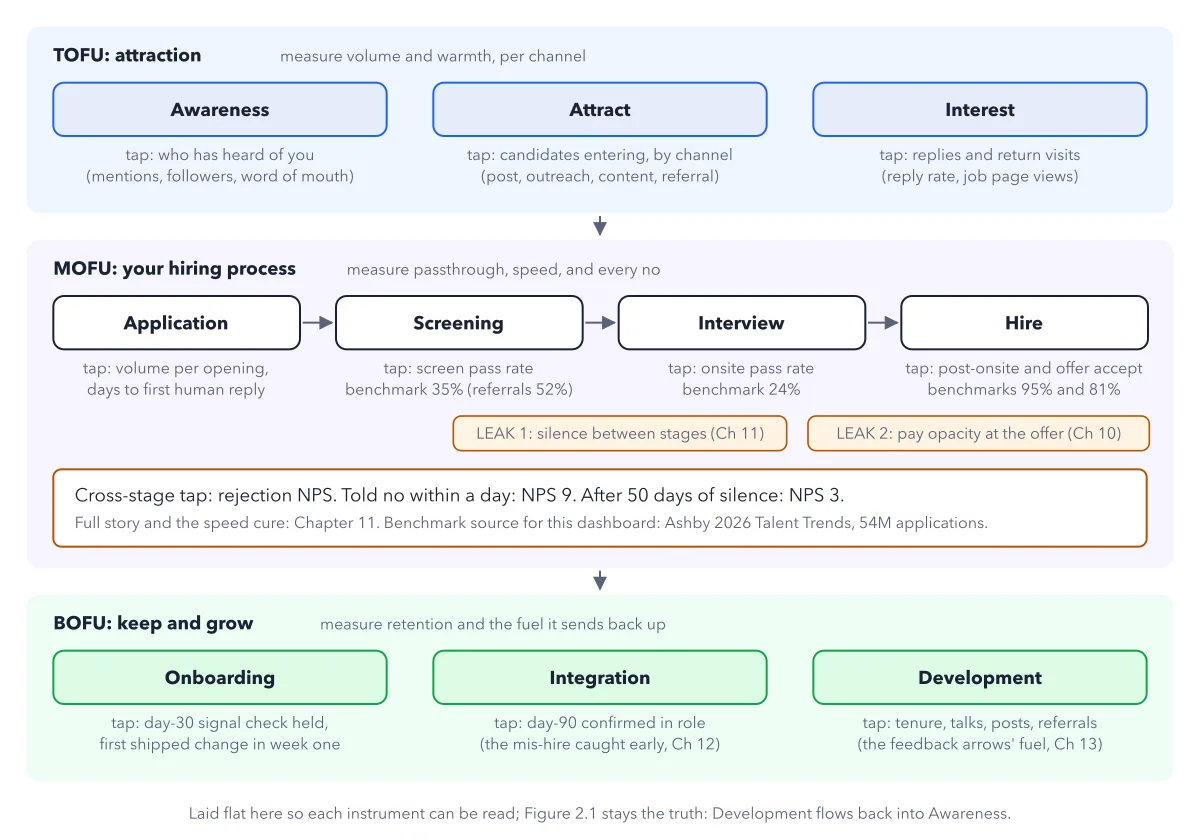
The funnel debug dashboard: one metric tap per stage
2026-09-03
The framework is the author's; the MOFU benchmark values are from Ashby's 2026 Talent Trends report, measured across 54 million applications. The rejection NPS tap and the silence leak get their full story in Chapter 11; the pay opacity leak is treated in Chapter 10.
Below: the paragraph from the book that builds this idea, then the diagram itself (Figure 2.2), and a recap. About a minute of reading.
The practical payoff of the funnel frame is that funnels can be debugged. No marketer says "we lose customers somewhere, oh well." They put a metric on every stage, find the step where prospects vanish, and fix that step first. Hiring deserves the same instrument panel. Two kinds of numbers matter at every stage: how many people are in it, and what share of them advance. That share is the stage's passthrough rate, the funnel's vital sign. Add speed (how many days each stage takes) and, for the people you reject, candidate NPS (a satisfaction score candidates give your process), and you can locate almost any problem. Figure 2.2 lays the ten stages flat, with one metric tap on each.
Recap
- The idea: The framework is the author's; the MOFU benchmark values are from Ashby's 2026 Talent Trends report, measured across 54 million applications.
- The picture: Figure 2.2, from chapter 2 ("The Full Stack Hiring Funnel") of Tech Hiring Made Crystal Clear.
- Go deeper: the chapter builds this step by step, with recipes and sources at the end.
This diagram is one of many in Tech Hiring Made Crystal Clear.
Every chapter opens with the gist, draws the hard ideas, and ends with recipes and sources.
Get the book